
70 Point PQL Score for SaaS: Scoring Template, Routing SLAs


A product qualified lead (PQL) is a user whose in-product behavior, not a marketing form fill, signals real buying intent. The main payoff: PQLs convert to paying customers far more reliably than marketing qualified leads, which means sales teams spend less time chasing cold outreach and more time closing accounts that already show they want the product. The rest of this piece breaks down the signals that define a PQL, a scoring template you can build this week, routing rules, and the metrics that tell you if the model is working.
TL;DR:
- PQLs are primarily identified through behavioral signals like high usage, intent actions, and team expansion, with thresholds typically set around 70 points.
- Routing PQLs to sales should involve filtering by firmographic fit and having explicit intent signals override behavioral scores to prevent overloading sales teams.
- Building a reliable PQL scoring system requires manual testing with recent accounts to determine 3-5 key conversion signals before automating.
- Response time is critical, with reply within an hour increasing close rates from 17% to over 53%, making SLA rules essential.
- Fewer than 25% of SaaS companies use structured PQL scoring, often missing significant conversion opportunities by not formalizing their approach.
Table of Contents
- What Is a Product Qualified Lead in SaaS?
- PQL vs SQL vs MQL: Where Each Fits in Your Funnel
- How Do You Build a PQL Scoring Model?
- When Should You Route a PQL to Sales?
- How Do You Implement and Test a PQL System?
- What Metrics Prove Your PQL Model Is Working?
- Trade-Offs and Governance in PQL Programs
- How Customerscore Helps You Operationalize PQL Scoring
- Sources
What Is a Product Qualified Lead in SaaS?
A PQL is defined by what a user does inside the product, not by what they downloaded or clicked in an email. That distinction matters because behavior is a stronger predictor of purchase intent than form data ever was. A prospect who fills out a "contact us" form might be curious. A prospect who invites three teammates and hits a usage cap in week two tells you, through action, that the product already solves a problem for them.
The signals that make up a PQL score generally fall into four buckets:
- Usage and adoption: login frequency, core-feature use, session depth
- Intent signals: visiting the pricing page, clicking "contact sales," hitting a free-tier limit
- Team expansion: inviting colleagues, creating multiple workspaces or projects
- Firmographic fit: company size, industry, and role of the person driving activity
This model works best in freemium, free-trial, and self-serve products where people can experience value before talking to anyone. It breaks down in pure enterprise pre-sales motions, where prospects never touch the product until a contract is signed. If your GTM motion starts with a discovery call instead of a signup link, PQL scoring has nothing to measure yet.
PQL vs SQL vs MQL: Where Each Fits in Your Funnel
The three lead types pull from different data and belong at different funnel stages. An MQL comes from marketing engagement (content downloads, webinar attendance, ad clicks). A PQL comes from product usage. An SQL is a lead sales has vetted and accepted as ready for a deal conversation, often built on top of PQL signals plus a fit check.
- MQLs: high volume, low conversion, usually single digits to low teens
- PQLs: lower volume, much higher conversion, commonly 25 to 30% conversion to paid once sales engages
- SQLs: PQLs (or MQLs) that pass a fit and readiness filter and get an active sales cycle
The practical move is to treat PQL as a filter that sits between raw usage data and a sales-ready SQL. Don't route every PQL straight to a rep. Combine the behavior signal with account fit first, then let the highest scoring, best fit accounts become SQLs. Everything else stays in self-serve nurture until it earns a second look.
How Do You Build a PQL Scoring Model?
Start by pulling the behavior history of your last several dozen converted accounts and comparing them against a similar batch of accounts that churned or never converted. Look at the 7 to 14 days before conversion specifically. That window usually reveals which two or three actions consistently show up before someone becomes a customer, and that's a stronger signal than any assumption you'd make from a whiteboard session.
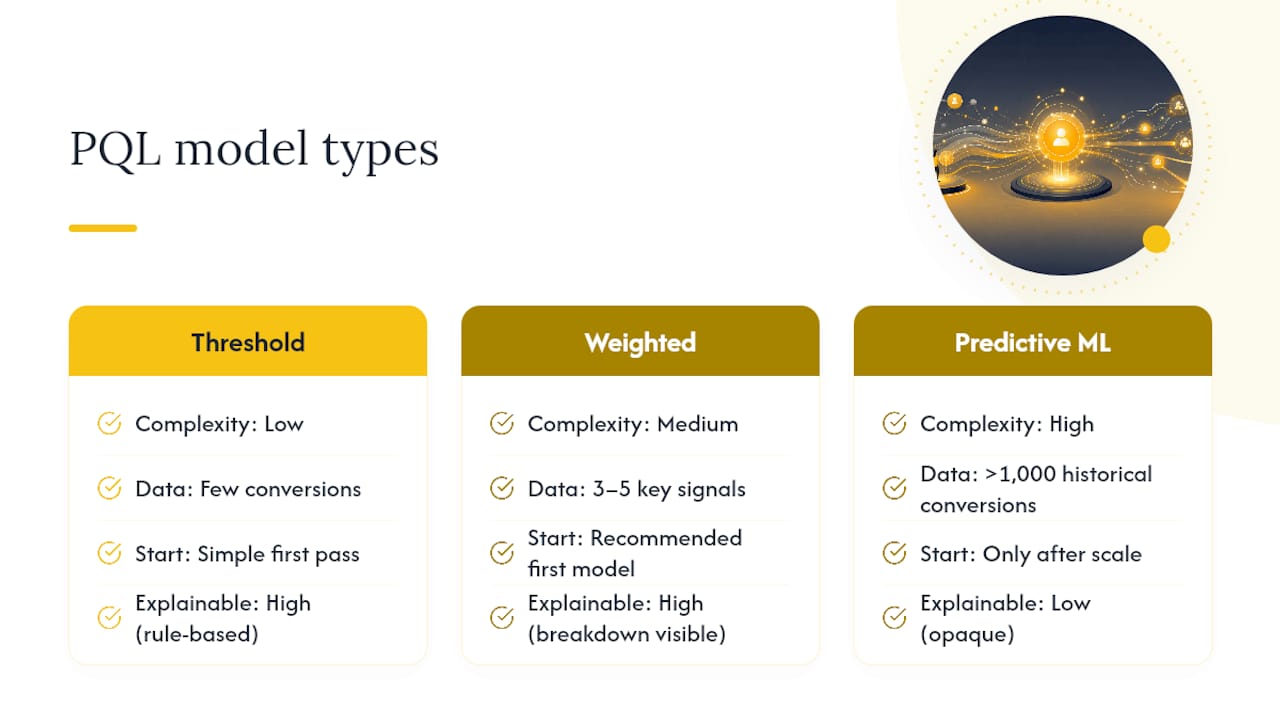
Three model types exist, in order of complexity: a threshold model (hit X actions, get flagged), a weighted point model (different actions carry different weight), and a predictive ML model (trained on historical outcomes). Start with threshold or weighted scoring. A simple 3 to 5 signal model calibrated against real converters usually captures most of the value a complex model would, without the engineering lift, and ML tends to need over 1,000 historical conversions before it outperforms a basic weighted score.
Here's a working example based on common activation patterns, using a 70-point qualification threshold:
Sum the points a user has accumulated, and once they cross 70, they qualify as a PQL. Recalibrate the weights quarterly against fresh conversion data, since a signal that mattered at 50 customers might mean something different at 500.
Pro Tip: If sales can't explain in under a minute why a lead scored as a PQL, the model is too opaque to be useful. Weighted point systems win adoption precisely because a rep can glance at the breakdown and immediately see the story.
When Should You Route a PQL to Sales?
Not every PQL deserves a rep's time, and overrouting is one of the fastest ways to burn sales team trust in the whole system. The fix is to layer account fit on top of behavior before anything reaches a human inbox.
- Filter by fit first. Combine the usage score with firmographic data (company size, industry, seat count) so only accounts with real expansion potential get flagged.
- Let explicit intent signals override the score. A pricing page visit, a "contact sales" click, or a hard limit hit should trigger review even if the cumulative point total hasn't crossed threshold yet.
- Set response SLAs by heat level. Hot PQLs (limit hits, contact-sales clicks) get under one hour. Warm PQLs (steady usage climbing toward threshold) get under 24 hours.
- Standardize the handoff payload. Send the rep the score, the specific signals that triggered it, account size, and current plan tier, not just a name and an email address.
- Run a deal-size check before routing. If the expected deal value doesn't clear a multiple of the fully loaded cost of a rep's time, send the account to self-serve nurture instead of a live rep.
Response speed alone swings outcomes hard. Reps who respond within an hour of a PQL trigger close at roughly 53%, compared to 17% for replies after 24 hours. That gap alone justifies building the SLA rule before you scale the volume of leads flowing through it.
How Do You Implement and Test a PQL System?
Building the full system on day one is a mistake most teams make once and don't repeat. Start manual, prove the signal works, then automate.
- Pull your last 100 converters and 100 churned or non-converting accounts. Compare their behavior in the two weeks before the outcome and identify 3 to 5 signals that reliably separate the two groups.
- Set a conservative threshold and run it manually for two weeks. Export the flagged accounts to a spreadsheet, hand them to sales, and track what happens before you automate anything.
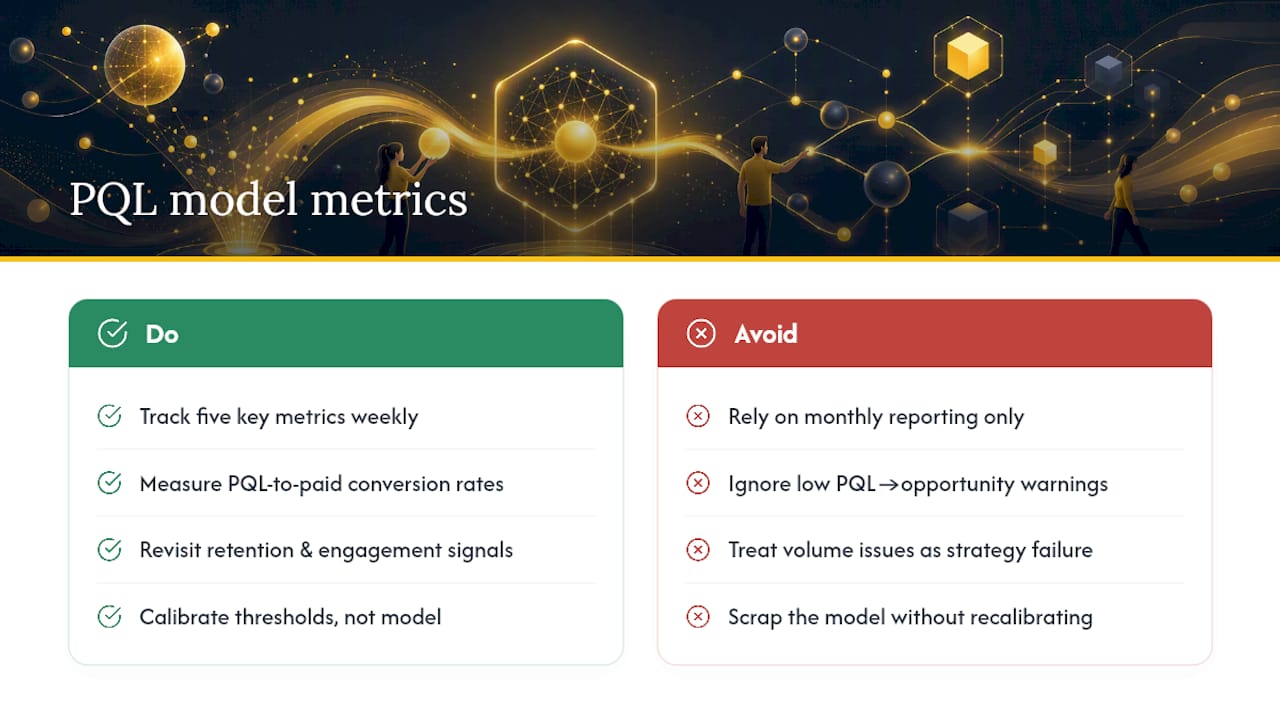
- Monitor PQL-to-paid weekly once the model goes live, and treat the first month as a calibration period, not a victory lap.
- Test routing changes with A/B splits and revisit thresholds monthly or quarterly as your product and customer base evolve.
Fewer companies run this systematically than you'd expect. Roughly 24% of product-led growth companies score PQLs in any structured way, which means most are leaving conversion on the table simply by not building the loop at all.
Pro Tip: Resist the urge to automate before the manual version proves out. A spreadsheet that correctly flags 20 good accounts a week beats an automated system flagging 200 accounts nobody trusts.
What Metrics Prove Your PQL Model Is Working?
Five numbers matter more than the rest: PQL generation rate (how many qualify per week), PQL-to-opportunity rate, PQL-to-closed-won rate, time-to-close for PQL-sourced deals, and revenue per PQL. Track them weekly, not monthly, especially in the first quarter after launch.
PQLs convert 3 to 5 times better than MQLs in most benchmark comparisons, with PQL-to-paid conversion commonly landing in the 25 to 30% range once a rep actively engages, versus single-digit conversion typical of MQLs.
If your PQL-to-opportunity rate is low, the threshold is probably too loose and sales is drowning in noise — a common challenge discussed in analytics for content marketing: boosting SaaS growth. If your PQL volume is thin and reps are asking for more leads, the threshold is too tight or you're missing a signal entirely. Either direction is a calibration problem, not a strategy failure, and the fix is almost always to revisit the retention and engagement metrics feeding the score rather than scrapping the model outright.
One clarification worth a sentence: outside of SaaS growth, "PQL" also refers to Process Query Language, a read-only query language used in process-analytics tools like Celonis. Different field, same acronym, worth knowing if you're searching around the term.
Trade-Offs and Governance in PQL Programs
Most teams overbuild the model and underbuild the trust around it. An explainable weighted score that sales actually uses beats a sophisticated ML model that gets ignored because nobody can say why a lead was flagged. Route sparingly, too. Chasing every PQL wastes rep hours on accounts that will never justify the cost of a sales conversation, so filter hard on expansion economics before anyone picks up the phone.
The programs that hold up over time treat PQL scoring as a shared asset, not a sales tool or a product team side project. Product, sales, and customer success should review the same dashboard quarterly and argue about the same thresholds together, because the model decays the moment one team stops paying attention to it.
— Patrik
How Customerscore Helps You Operationalize PQL Scoring
Building a PQL model by hand in spreadsheets works for the first few months, but it stalls once usage data lives in one tool, billing in another, and CRM notes in a third. Customerscore pulls all three into one view, an AI-driven health scoring and churn prediction platform that ties usage depth, firmographic fit, and account health into a single explainable score, with alerts that route accounts to sales or CS the moment they cross your threshold.
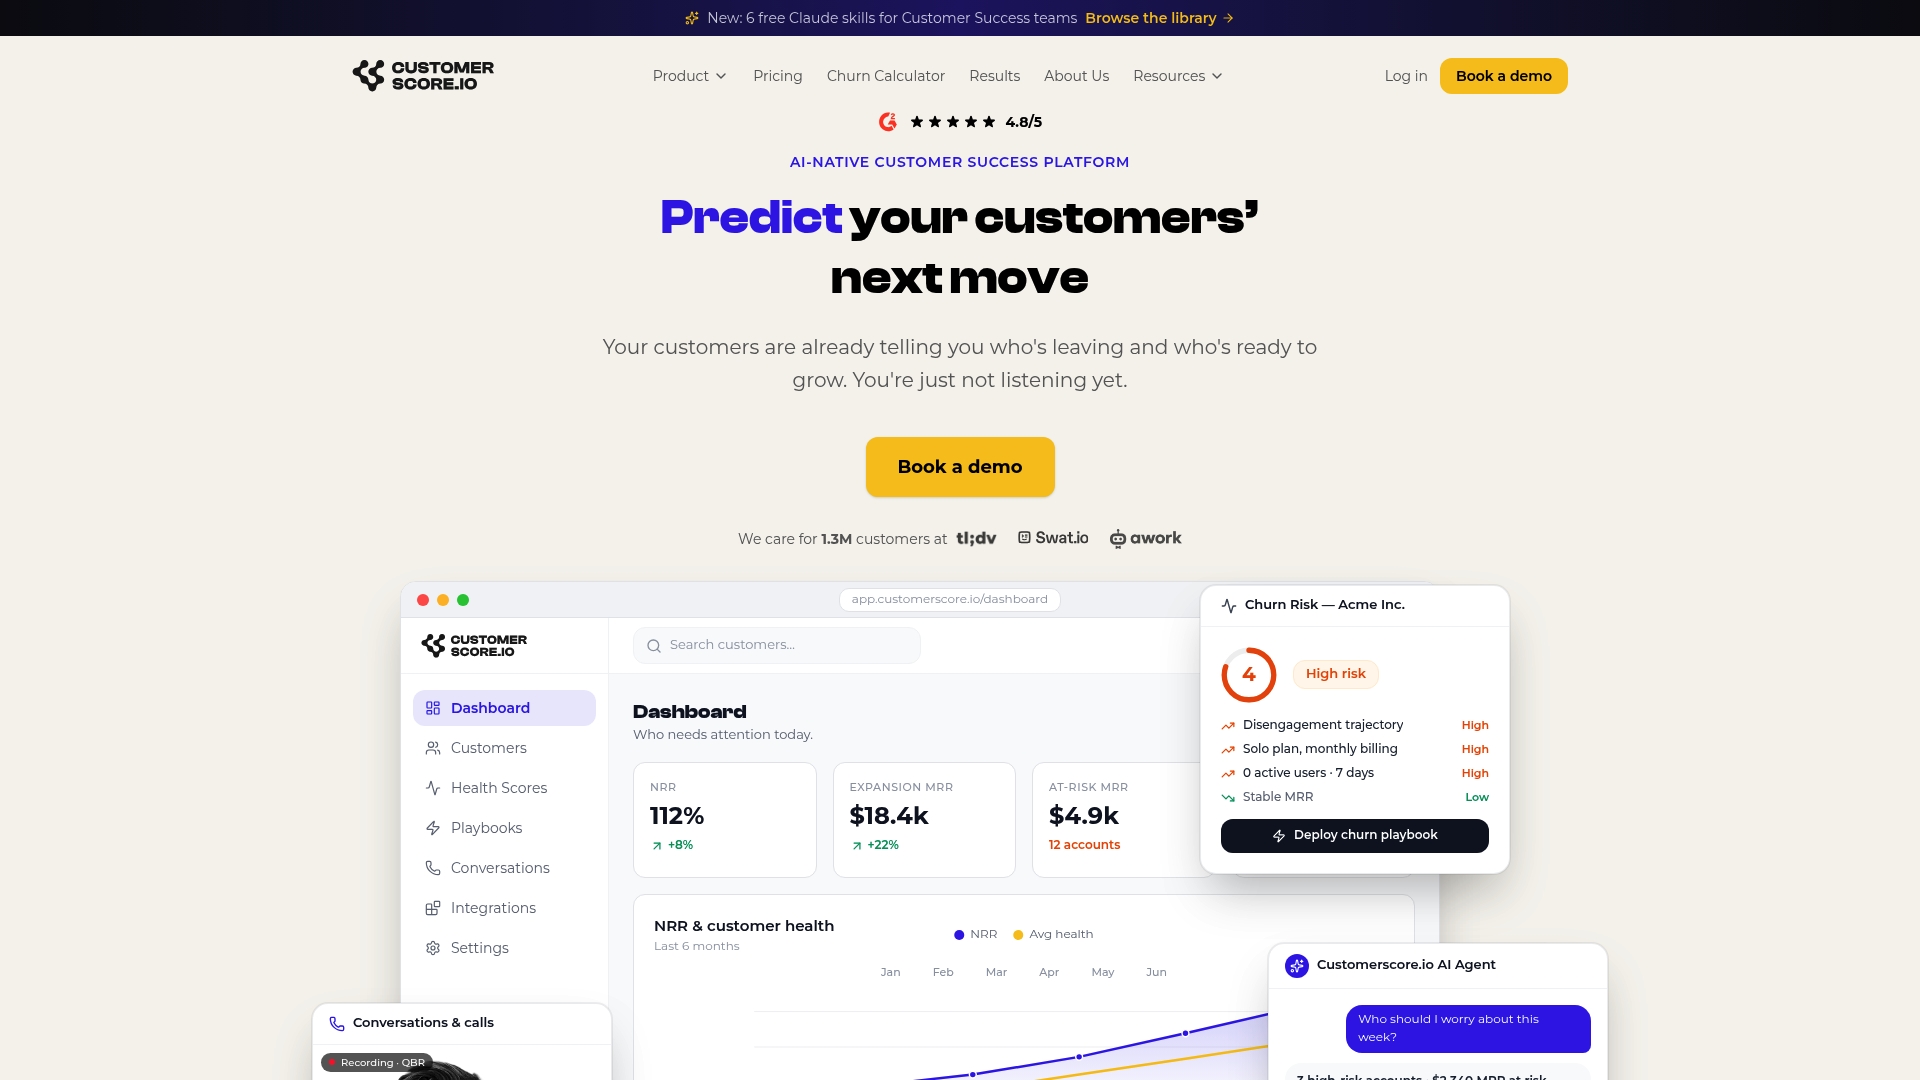
A demo walks through live PQL dashboards, sample handoff payloads formatted for your CRM, and an integration checklist covering tools like HubSpot, Salesforce, Stripe, and Segment. If you're already scoring leads manually and hitting the automation wall, book a demo and see how the health score model handles the calibration work your spreadsheet can't.
Sources
- How to define PQLs (ProductLed)
- Product Qualified Leads (PQLs): Using product data to identify high-intent buyers (2026 Guide)
- Product-led sales (PLS) in SaaS: PQL routing, sales motion, and team structure
Recommended
Related articles
Recover 55–70% of Failed Payments: SaaS Dunning Meets Churn Prediction
Recover 55–70% of Failed Payments: SaaS Dunning Meets Churn Prediction ! Specialist reviewing a failed payment alert Dunning is the structured recovery workflow that fixes failed subscription
BlogCut Churn: Product Usage Analytics for SaaS, Backed by 44,000 Users
Cut Churn: Product Usage Analytics for SaaS, Backed by 44,000 Users ! Analyst reviewing SaaS usage analytics dashboard Product usage analytics tracks what individual users actually do inside your
BlogSix Step Escalation Playbook for B2B SaaS CSMs to Prevent Quiet Churn
Six Step Escalation Playbook for B2B SaaS CSMs to Prevent Quiet Churn ! CSM sending a daily escalation update An escalation playbook has one job: protect the relationship and resolve high-impact
Blog120–90 Day SaaS Renewal Management Playbook for CS & RevOps, Ops First
120–90 Day SaaS Renewal Management Playbook for CS & RevOps, Ops First ! CS and RevOps team planning renewal workflow SaaS renewal management is the operational system that moves a customer from