
Churn Propensity Model: A Practitioner's Guide


A churn propensity model assigns every customer a numerical risk score, typically on a 0 to 1 probability scale or a 1 to 10 index, that ranks how likely they are to cancel or lapse in a defined window. The verdict for anyone building or buying one: use the score to segment customers, trigger the right playbook at the right risk band, and then measure whether your intervention actually moved the needle. That last part is where most teams stop short.
Three things ground how these models actually operate in production:
- Score formats vary by vendor. Oracle's implementation outputs a 0 to 1 probability mapped to Very Low through Very High risk buckets, while Recurly's model uses a 1 to 10 scale.
- Scores are not static. Recurly recalculates on every new engagement event or automatically every five days of inactivity.
- Many implementations pair the churn score with a predicted customer lifetime value, giving you both a risk signal and a dollar amount to prioritize against, as seen in Amperity's model outputs.
Key Takeaways
A churn propensity model turns raw customer data into a per-account risk score that only creates value when it's tied to a specific playbook and measured against actual retention outcomes.
| Point | Details |
|---|---|
| Score format varies by vendor | Expect 0–1 probability scales or 1–10 risk indexes; map both to labeled risk buckets for action. |
| Pair risk with revenue | Cross churn score with predicted CLV or plan value so high-risk accounts get prioritized by dollars, not just rank. |
| Avoid data leakage | Keep a strict cutoff between feature windows and label windows to prevent inflated accuracy. |
| Start simple, then graduate | Use a weighted composite score first; move to machine learning once enough labeled churn events exist. |
| Evaluate with AUC, precision@k, and calibration | Accuracy alone hides poor performance on imbalanced churn data. |
| Customerscore unifies the pipeline | Combines multi-source data, explainable scoring, and automated playbooks in one platform for B2B SaaS teams. |
Table of Contents
- What a Churn Propensity Score Actually Tells You
- Which Data Sources and Features Actually Predict Churn
- Choosing a Modeling Approach: Rules, Scores, or Machine Learning
- Building the Pipeline: From Raw Data to a Live Score
- How Do You Know the Model Actually Works?
- Turning Scores Into Retention Campaigns
- What Breaks Churn Models in Practice
- How Customerscore Approaches Explainable Churn Scoring
- What Actually Moves the Needle
- See How Customerscore Scores and Prevents Churn
- Frequently Asked Questions
- Sources
What a Churn Propensity Score Actually Tells You
The number itself is only half the story. What matters operationally is how that number gets bucketed and what predicted revenue sits behind it.
Vendors differ on scale, but the interpretation logic is consistent: low scores mean stable accounts, high scores mean act now. Oracle's model outputs a continuous 0 to 1 probability and then maps ranges into five labeled tiers, an approach that mirrors what most in-house teams build when they move past a simple percentage. Amperity takes a different angle, pairing churn probability with lifecycle status labels like Active, Cooling down, At risk, and Lost, alongside predicted customer lifetime value and predicted order frequency for the next 365 days.
| Score/Scale | Typical Risk Bucket | Operational Meaning |
|---|---|---|
| Very Low through Low (or 1–2) | Very low | No action; monitor in standard cadence |
| Low through Medium Low (or 3–4) | Low | Include in nurture email sequences |
| Medium (or 5–6) | Medium | Trigger in-app guidance or usage nudges |
| Medium High through High (or 7–8) | High | CSM outreach or targeted save-offer |
| Very High (or 9–10) | Very high | Immediate escalation and retention flow |
Predicted CLV changes how you prioritize inside each bucket. A "High" risk account with higher projected annual revenue deserves a different response than a lower-value account with the same risk level. That is the entire point of pairing a churn score with a revenue estimate instead of treating every at risk account the same.
Pro Tip: Don't build your action map around risk bucket alone. Cross it with predicted revenue or plan tier first. A cheap self-serve account and an enterprise account can land in the same bucket and need completely different playbooks.
Which Data Sources and Features Actually Predict Churn
A model is only as good as what feeds it. Most working churn propensity models pull from five source categories: product usage logs, billing and transaction history, support ticket data, CRM activity, and engagement signals like email opens and login sessions. Miss one of these, and you are usually missing the earliest warning sign, since payment failures and support escalations tend to precede cancellation by weeks, not days.
Feature engineering is where the real differentiation happens. Raw usage counts rarely predict churn well on their own. What works better:
- Usage trend slope over the last 30 and 90 days, not just a snapshot total.
- Recency, frequency, and monetary (RFM) scoring adapted from retail, applied to feature usage instead of purchases.
- Payment behavior: failed charges, downgrade requests, and days-to-pay drift.
- Support ticket severity and volume trend, plus sentiment where you have transcript data.
- Feature-adoption depth: has the account activated the features tied to your product's core value?
- Time-to-value: how long it took a new account to reach its first meaningful outcome.
Lookback windows depend heavily on business model. SaaS subscriptions with monthly billing cycles usually work well with 30 to 90 day windows for behavioral features, since usage patterns compress quickly. B2C retail needs longer windows to account for seasonality. A customer who buys once every eight months isn't churning, they're just on a longer cycle, and treating a natural gap as risk inflates your false positive rate. Amperity's guidance reflects this split directly: churn windows of 30 to 90 days for labeling, but multi-year lookbacks (three to five years) for stable predicted lifetime value.
Pro Tip: The most common feature-engineering mistake is leaking the label into your inputs. If a customer's last invoice failed the same week they canceled, a "payment failed in last 7 days" feature captures the cancellation, not a predictor of it. Build a strict cutoff date between your feature window and your label window, and never let a feature use data from inside or after the churn window itself.
Choosing a Modeling Approach: Rules, Scores, or Machine Learning
You have four realistic paths, and the right one depends on how much labeled churn data you have, not how sophisticated your team is.
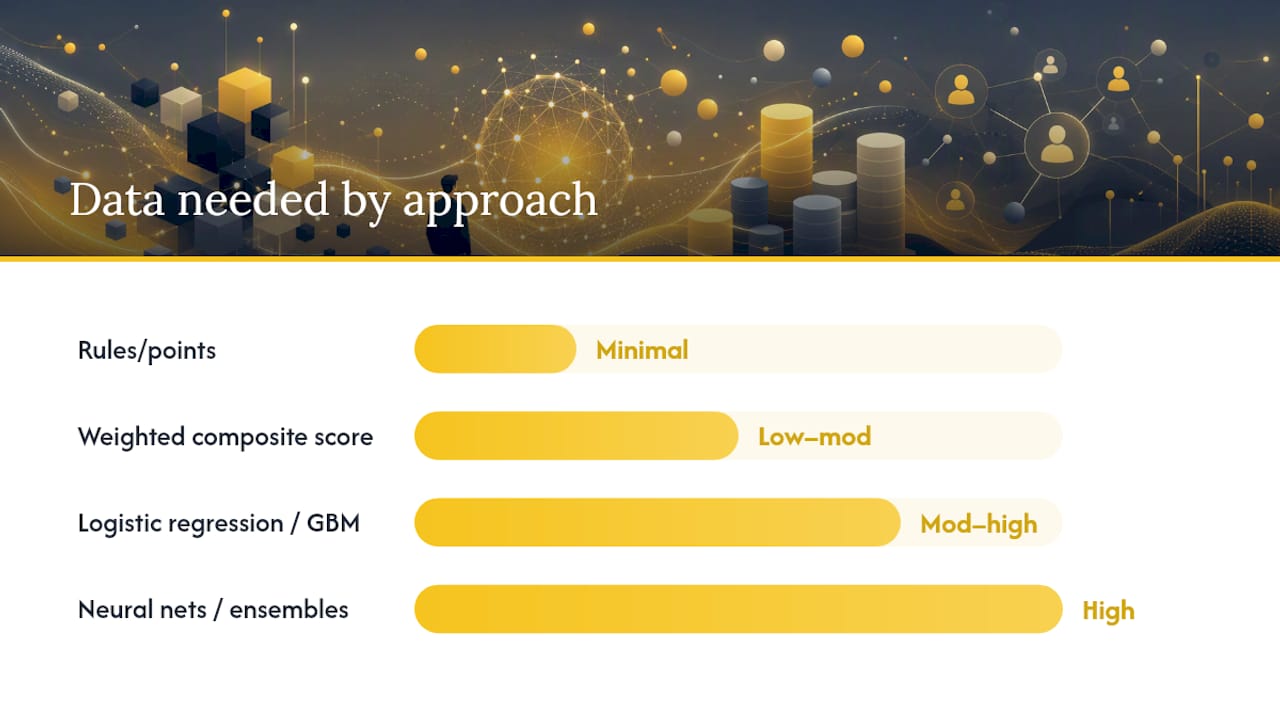
A rule-based or points system assigns fixed point values to conditions ("minus 10 points if no login in 14 days") and sums them into a score. It is fast to build and completely transparent, but brittle. A weighted composite health score improves on this by normalizing signals into categories and applying business-defined weights, and Basedash recommends starting here with 4 to 6 core components before touching machine learning at all. Logistic regression and gradient-boosted trees (GBM) come next, requiring enough historical churn events to train on, usually several hundred at minimum, but rewarding you with real probability estimates. Neural networks and ensemble methods sit at the top end, useful for large B2C datasets with rich behavioral history, but they demand more maintenance and are harder to explain to a customer success manager who wants to know why an account is flagged.
| Approach | Data needed | Explainability | Maintenance |
|---|---|---|---|
| Rules/points | Minimal | High | Low |
| Weighted composite score | Low to moderate | High | Low to moderate |
| Logistic regression/GBM | Moderate to high | Moderate | Moderate |
| Neural nets/ensembles | High | Low | High |
Whatever you choose beyond a rules-based system, calibrate the output. A raw model score of 0.7 does not necessarily mean a 70% chance of churn. Techniques like Platt scaling or isotonic regression adjust the score distribution so it actually reflects observed churn rates, which matters enormously once you start setting business rules on top of the number, like triggering a save-offer only above a certain threshold.
Graduate from a transparent score to a learned model once you have enough churn events to train and validate on, and once the business itself is stable enough that last quarter's patterns still apply next quarter. Moving to machine learning during a pricing overhaul or a major product relaunch usually just teaches the model outdated behavior.
Building the Pipeline: From Raw Data to a Live Score
Building a churn propensity model is less about picking an algorithm and more about getting the plumbing right. Here's the order that actually works:
- Define your churn label and window first. For SaaS, a common definition is no renewal or no product activity within a defined period, such as 30 or 60 days past the expected renewal date. For B2C, define churn as a purchase gap exceeding some multiple of a customer's typical repurchase cycle, not a fixed calendar number.
- Set your prediction horizon. Are you predicting who churns in the next 30 days or the next 90? This determines how far ahead your features need to look.
- Build the training dataset with strict time alignment. Every row's features must come from before the label window starts. This is the single most common source of data leakage.
- Split by time, not randomly. Train on older cohorts, validate on more recent ones, so your evaluation mimics how the model will actually be used.
- Generate features and select an algorithm based on your data volume and explainability needs, per the tradeoffs above.
- Deploy for scoring, batch or real-time depending on your use case.
A few operational details determine whether this pipeline survives contact with production:
- Batch scoring (nightly or weekly) works fine for email campaigns and CSM dashboards; real-time scoring matters only if you're triggering in-app interventions the moment risk changes.
- A feature store or a stable, versioned feature generation pipeline prevents the classic problem where your training features and your production features drift apart silently.
- Log every scored prediction with a timestamp in an append-only table so you can backtest later without recomputing history from scratch.
- Class imbalance is the norm in churn data, since most customers don't churn in any given window. Resampling techniques, class weights, or focal loss all help; pick whichever your algorithm supports natively rather than bolting on a separate resampling step that distorts your feature distributions.
Pro Tip: Retrain on a fixed cadence, but also build triggers for emergency retraining. A pricing change, a major feature launch, or a shift in your ideal customer profile can silently invalidate a model that was accurate three months ago. For teams building this from scratch, practical churn prediction guidance for SaaS walks through the data sources in more depth.
How Do You Know the Model Actually Works?
Accuracy alone tells you almost nothing about a churn model, because a model that predicts "no churn" for everyone can still score 90%+ accuracy when churn rates are low. You need metrics built for imbalanced, ranked predictions.
ROC AUC measures how well the model ranks churners above non-churners across all thresholds, and it's the standard first check. But AUC won't tell you if your top 100 flagged accounts are actually worth calling, which is where precision@k comes in: of the top k customers by predicted risk, how many actually churned? That's the metric that matters when your CSM team can only act on a limited list each week. Calibration testing checks whether a 0.7 score really corresponds to roughly 70% observed churn, essential if you're using the raw probability in automated decision rules rather than just ranking.
Backtesting should use anchored or rolling time splits: train on data through month six, predict month seven, then compare predicted churn rates per risk bucket against what actually happened.
Tie performance back to dollars: track retention rate delta in the intervened group versus a holdout, revenue saved per campaign, and cost per retained customer. That connection is what turns a model evaluation from a data science exercise into something a VP of Customer Success will actually fund.

Turning Scores Into Retention Campaigns
A churn score sitting in a dashboard does nothing. The value shows up when it drives a segmentation matrix, crossing risk level against customer value, so your team knows exactly where to spend limited attention.
Map interventions to bands like this:
- Low risk, high value: light-touch nurture, quarterly business reviews.
- Medium risk, any value: automated email drip plus in-app usage guides.
- High risk, high value: direct CSM escalation within 24 to 48 hours.
- High risk, low value: automated save-offer or discount flow, no human touch.
Propensity models earn their keep specifically when integrated with segmentation and campaign systems, not when they exist as a standalone report. That means feeding risk segments directly into your CDP, marketing automation platform, or CS tool so a score change triggers a workflow automatically, rather than waiting for someone to check a dashboard.
Run actual experiments before you scale any playbook. A/B test the offer against a no-offer control group, measure retention lift and revenue impact, and track precision@k on your targeting so you know the campaign reached the right accounts, not just a large number of them. Skipping this step is how teams end up sending save-offers to accounts that were never going to churn in the first place, training customers to expect a discount.
What Breaks Churn Models in Practice
Most churn model failures aren't algorithmic. They're governance failures. Version every model deployment, document which features feed it, assign an owner, and map each risk band to a specific playbook so nobody's guessing what "high risk" is supposed to trigger.
- Build hard overrides for critical events like a failed payment or a severity-1 support escalation, so a single averaged score never buries an urgent signal.
- Explain scores with feature importance or SHAP values, translated into plain language a CSM can act on without a statistics background.
- Retrain on a regular cadence, and treat pricing changes or major product shifts as emergency retrain triggers, not something to handle at the next scheduled cycle.
- Watch for the trap of confusing correlation with causation: a feature correlating with churn isn't necessarily something you can fix to prevent it.
- Don't let a vendor's black-box score override your own internal baseline without a comparison period first.
Pro Tip: Treat the model as a living system, not a one-time project. Backtest predicted scores against actual renewals on a fixed schedule, and adjust weights or swap model types the moment you see the gap widening.
How Customerscore Approaches Explainable Churn Scoring
Customerscore builds churn propensity scoring around explainability first, pulling in billing, product usage, CRM, and support data so the score reflects the full customer relationship rather than one data source in isolation. Health scoring and churn prediction run together, mapped to playbooks that trigger automatically at each risk band rather than sitting in a report nobody opens.
A few things worth carrying into your own build:
- Backtest continuously against actual renewals, not just at model launch.
- Weight signals by segment. Enterprise accounts and self-serve accounts churn for different reasons and shouldn't share one weighting scheme.
- Map every risk band to an owner and a specific next action, not a vague "monitor" instruction.
What Actually Moves the Needle
Start simple. A transparent, weighted health score with hard overrides for payment failures and escalations will change more CSM behavior in the first quarter than a sophisticated model nobody trusts. I've seen teams chase marginal AUC gains for months while ignoring that their CSMs quietly stopped checking the dashboard because they couldn't explain why an account scored the way it did.
Prioritize adoption over precision at the margins. Instrument the signals that actually reflect your product's value, assign a clear playbook to every risk band, and measure intervention lift before you scale anything. A model nobody acts on is worse than no model at all.
See How Customerscore Scores and Prevents Churn
Customerscore gives you one place to see churn risk, predicted revenue, and the exact playbook to run, instead of stitching together a spreadsheet model and three separate tools. It pulls billing data from Stripe or Chargebee, product usage from Mixpanel, PostHog, or Segment, and CRM activity from HubSpot or Salesforce into a single explainable score, then triggers alerts in Slack the moment an account crosses into a risk band that needs attention.
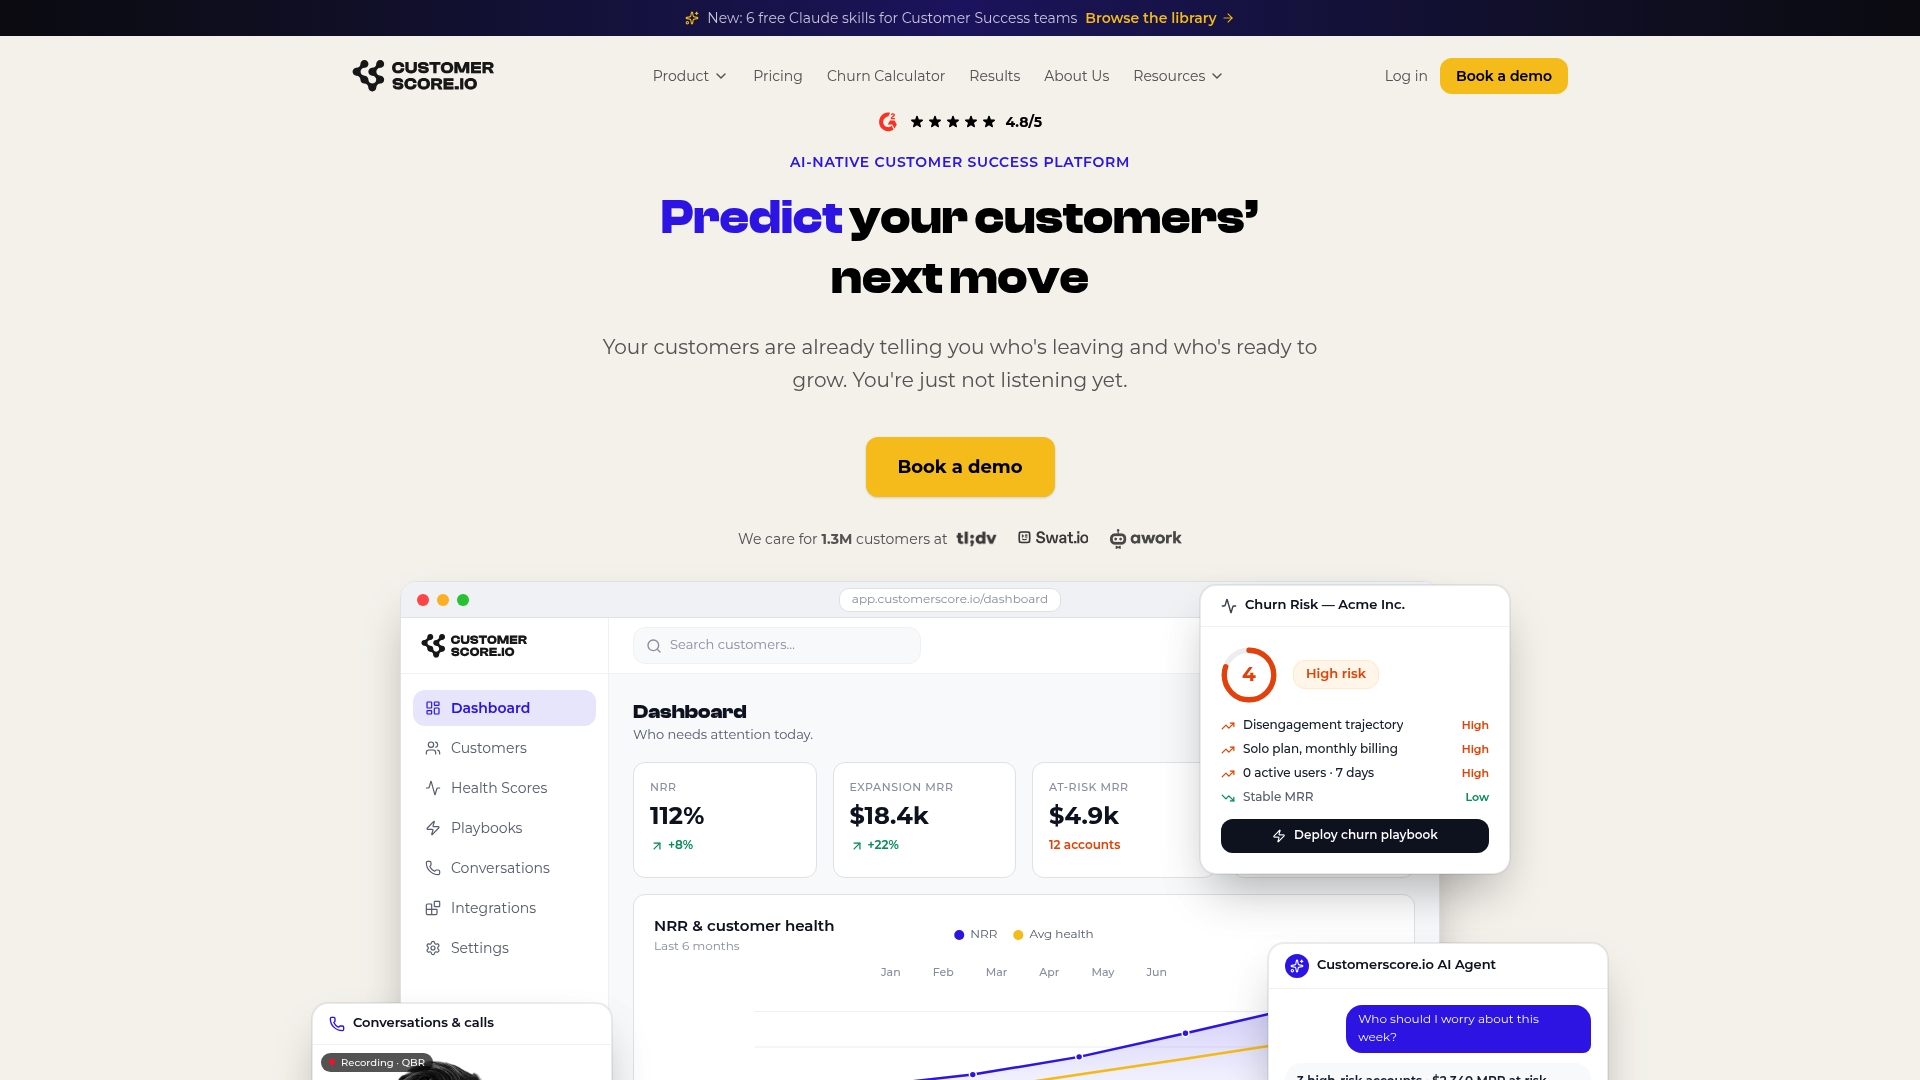
If you're currently relying on a spreadsheet-based health score or evaluating a dedicated churn prediction tool, the fastest way to see the difference is to look at your own data inside the platform. Book a demo and bring a handful of at-risk accounts. You'll walk out with a real risk score and a playbook recommendation for each one, not a generic sales deck.
Frequently Asked Questions
What is a churn propensity model? A churn propensity model is a statistical or machine learning model that scores each customer on their likelihood to cancel or lapse, typically expressed as a probability between 0 and 1 or an index from 1 to 10.
How is a churn propensity model different from a customer health score? A health score is usually a transparent, weighted composite built for human interpretation by customer success teams, while a churn propensity model is a statistical predictor trained on historical churn events. The two serve complementary roles and many teams run both side by side.
What data do I need to build a churn propensity model? At minimum: product usage logs, billing and transaction history, support ticket data, CRM activity, and engagement signals like email and login activity. Richer models add sentiment, NPS, and feature-adoption depth.
How often should a churn model be retrained? Retrain on a fixed cadence, often monthly or quarterly depending on data volume, and immediately after major pricing changes, product relaunches, or shifts in your customer base.
What's a good churn window for a SaaS business versus a B2C business? SaaS businesses often use 30 to 90 day windows tied to renewal cycles, while B2C retail needs longer, purchase-pattern-based windows to avoid mistaking a normal buying gap for churn risk.
Sources
- Churn Propensity model - Oracle documentation
- Churn propensity modeling - Recurly
- Churn propensity model - Amperity documentation
- How to build a customer health score - Basedash
Recommended
Related articles
Cut CSM Intervention 18%: Predictive Playbooks for CS & RevOps
Cut CSM Intervention 18%: Predictive Playbooks for CS & RevOps ! Predictive playbook geometric title card Predictive playbooks link a churn prediction to a specific, repeatable action so customer
BlogPinpoint B2B SaaS Adoption Gaps and the Fix That Lifts Renewal
Pinpoint B2B SaaS Adoption Gaps and the Fix That Lifts Renewal ! Analysts reviewing SaaS adoption gaps Adoption gap analysis identifies the funnel stage where eligible users or accounts fail to reach
BlogAnalysts: 6–12 Month Cohort Forecasts for Net Dollar Retention
Analysts: 6–12 Month Cohort Forecasts for Net Dollar Retention ! Analyst reviewing cohort retention forecast The most reliable way to forecast net dollar retention is cohort-based modeling that
BlogStop Surprise Churn: 5 Phase Data Mapping for RevOps and CS
Stop Surprise Churn: 5 Phase Data Mapping for RevOps and CS ! Analyst mapping customer data fields Data mapping for CS means connecting product usage, billing, CRM, and support data to the fields your