
Cut CSM Intervention 18%: Predictive Playbooks for CS & RevOps


Predictive playbooks link a churn prediction to a specific, repeatable action so customer success teams stop reacting and start intervening early. Done right, they turn a health score into a prioritized list of accounts, each paired with an owner and a next step, which drives faster saves and higher net revenue retention. The catch is that they only work when the underlying data is connected, the scoring is explainable, and the routing actually reaches a human or automated action.
TL;DR:
- Predictive playbooks require connected data, explainable scoring, and routing to a human or automated action to be effective.
- Reliable signals include product usage drops, support ticket increases, billing issues, satisfaction declines, and contract changes, smoothed over time.
- Building a playbook starts with clean data and simple models like rule-based scoring, progressing to machine learning as scale increases, with explainability key to adoption.
- Alert management techniques such as prioritization, throttling, persistence checks, and integration with existing tools are vital to prevent CSM burnout.
- Measuring success involves both business metrics like retention and operational metrics such as alert response time, with pilot testing recommended before scaling.
Table of Contents
- What predictive playbooks are and why they matter for B2B SaaS
- Which signals reliably predict churn before it happens
- How to build a predictive playbook from data to intervention
- Turning alerts into action without burning out your team
- How to measure whether your playbooks are actually working
- How Customerscore applies predictive playbooks in practice
- What most teams get wrong about predictive churn models
- How Customerscore turns prediction into practice for your team
- Sources
- FAQ
What predictive playbooks are and why they matter for B2B SaaS
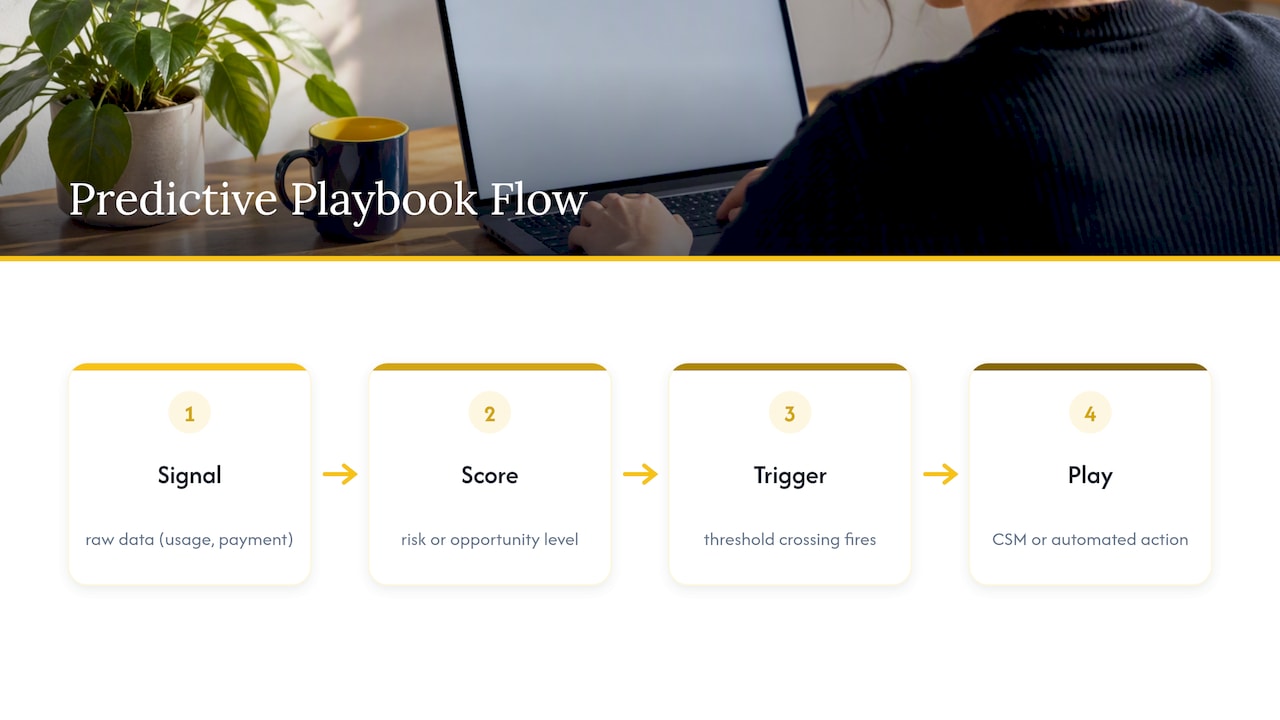
A predictive playbook has four parts: a signal, a score, a trigger, and a play. Signals are the raw data (a usage drop, a failed payment). The score converts those signals into a risk or opportunity level. The trigger fires when that score crosses a threshold. The play is the specific action a CSM or automated workflow takes in response, whether that is a check-in call during a rocky onboarding or a renewal outreach sequence 60 days before contract expiration.
This is different from ad hoc outreach, where CSMs rely on memory and gut feel to decide who needs attention, and it is different from a static health score that just sits in a dashboard without a defined next step. A health score becomes a playbook only when it is tied to an owner, a timeline, and a template action.
Not every team needs this on day one. Predictive playbooks pay off once a company has enough accounts that manual triage misses risk, once churn is costly enough to justify the build, or once the CS team is stretched thin enough that prioritization itself becomes the bottleneck. A ten-account book of business rarely needs a model. A CSM managing 150 accounts across multiple segments does.
The business outcomes teams should expect are concrete: fewer accounts slipping through the first 90 days unnoticed, shorter time-to-value because onboarding risk gets flagged early, and a measurable lift in net revenue retention as renewal and expansion signals get acted on instead of discovered after the fact. None of this requires a large data science team to start. It requires clean data, a small number of well-designed plays, and a way to route them to the right person at the right moment.
Which signals reliably predict churn before it happens
Most churn is visible in the data weeks before a customer says anything, a concept well supported by effective customer retention strategies that leverage early data signals to improve outcomes. The trick is knowing which signals to trust and how to smooth out the noise so a single bad week does not trigger a false alarm.
- Product usage: declining daily or monthly active use, drop-off in a core feature, and shrinking session depth all point toward disengagement.
- Support signals: a spike in ticket volume, tickets that stay unresolved past a normal window, and negative sentiment in support transcripts.
- Billing signals: failed payments, downgrades, and a change in the billing contact, which often means the original champion has left.
- Satisfaction signals: a falling NPS score and a drop in survey response rate, since silence is itself a signal.
- Contract signals: a reduced seat count, contract amendments, and renewal terms that get shortened instead of extended.
Raw counts of any of these signals are volatile on their own. A single quiet week in product usage does not mean a customer is leaving, and a single spike in tickets does not mean they are either. Practitioner guidance recommends smoothing interaction data with a 7-day weighted rolling average and mapping it onto a normalized scale, such as 0.0 to 5.0, so CSMs see a stable trend rather than daily noise. Seasonality matters too: a dip in usage the week of a major holiday reads very differently from the same dip in the middle of a normal quarter.
The 7-day weighted rolling average, mapped to a 0 to 5 health scale, is the technique practitioner research recommends for turning volatile raw usage data into a stable, actionable score. That stability is what makes a CSM trust the alert enough to act on it instead of ignoring it as noise.
Support and billing signals should be treated with the same discipline. A pattern of two or three late payments in a row is a stronger signal than any single missed invoice, and a support ticket that gets reopened multiple times matters more than raw ticket count. Isolated data points create false urgency, while trend lines create confidence.
How to build a predictive playbook from data to intervention
Building a predictive playbook starts with the data layer, not the model. You need product telemetry, billing history, CRM records, and support tickets flowing into one place, with basic quality checks (deduplication, timestamp consistency, and handling for missing values) before any scoring happens. A model built on inconsistent data will produce inconsistent, and eventually ignored, alerts.
From there, the model choice depends on maturity and scale:
- Rule-based scoring works well as a starting point: if usage drops by a defined percentage and a payment fails, flag the account. It is transparent and fast to build, but it does not adapt and can miss subtler combinations of risk.
- Statistical scoring adds cohort comparisons, so a customer's usage is judged against similar accounts rather than an arbitrary fixed threshold. This catches segment-specific patterns that rule-based systems miss.
- Machine learning classifiers scale best across large customer bases and can weigh dozens of signals simultaneously, but they need enough historical data and ongoing monitoring to stay accurate as customer behavior shifts.
Whichever model level a team uses, explainability is what determines adoption. Feature importance and local explanation techniques such as SHAP or LIME translate a model's internal math into the kind of plain-language reason a human can use in a customer conversation, and practitioner guidance treats explainability as the deciding factor in whether CSM teams act on predictions at all.
Once a model produces a score, the playbook itself needs four design elements: the trigger threshold that fires the alert, a template for the intervention (an email sequence, a call script, an in-product message), a named owner responsible for executing it, and an escalation path if the first attempt does not resolve the risk within a set window.
Pro Tip: Build one playbook end to end, from signal to resolved outcome, before trying to scale to a dozen at once.
Before rolling a new model out broadly, validate it the way any predictive system should be validated: hold out a portion of historical data the model never saw, measure how well it ranks true churners near the top (precision@k) and how well its predicted probabilities match actual outcomes (calibration), and check overall discrimination with AUC. One simulation-based model evaluated on 12,850 SaaS customers achieved an AUC of 0.904 and 78.4% 30-day retention while cutting the CSM intervention rate by 18%, largely by testing which interventions a counterfactual approach predicted would actually help before deploying them at scale. A small pilot with a holdout group, run before a full rollout, is the cheapest way to catch a model that looks good in testing but does not hold up with real CSMs acting on real alerts.
Turning alerts into action without burning out your team
A model that generates fifty urgent alerts a day is worse than no model at all, because CSMs will eventually stop reading them. Alert design has to account for this from the start.
- Priority buckets: separate accounts into tiers (immediate, this week, monitor) so CSMs know where to spend limited time first.
- Noise reduction: require a signal to persist for a set window, not just spike once, before it triggers an alert.
- Throttling: cap how many new alerts a single CSM receives per day to prevent fatigue.
- Routing rules: decide up front which alerts go to a human CSM and which trigger an automated email or in-product nudge, based on account value and the type of risk.
- Escalation: define what happens if an alert goes unaddressed for a set period, whether that means a manager gets notified or the case gets reassigned.
Not every intervention needs a person. Low-touch accounts with a mild usage dip might get an automated email or an in-product banner with a helpful tip, while a high-value account showing multiple risk signals at once should route straight to a CSM with full context attached. The riskier or higher-value the account, the more a human touch matters; the more routine the signal, the more automation makes sense.
Integrations matter as much as the model itself. Alerts need to land where the CSM already works, whether that is the CRM, a ticketing system, or a messaging tool like Slack, and in-product banners need to reach the customer directly rather than sitting in a report nobody opens. Automating the handoff between prediction and outreach is often the difference between a playbook that gets used and one that gets ignored after the first month.
Pro Tip: Run a two-week shadow period where the model generates alerts but nobody acts on them differently, just to see how many are actually worth a CSM's time before flipping the system on for real.
Getting a team to trust a new scoring system takes deliberate onboarding: walk CSMs through a handful of real examples where the model was right, show them the reasoning behind a few alerts, and build in a feedback loop where they can flag a bad prediction so the model or its thresholds get adjusted over time.

How to measure whether your playbooks are actually working
Three layers of metrics matter here, and conflating them is a common mistake. Business KPIs tell you if the program is working overall: churn rate, 30-day and 90-day retention, and net revenue retention. Operational metrics tell you if the team is executing: time from alert to first action, the save rate on flagged accounts, and conversion on outreach.
- Model quality: one evaluated simulation-based model reached 0.904 AUC and 78.4% 30-day retention on 12,850 customers, giving a concrete reference point for what a well-built system can achieve.
- Business impact: McKinsey's analysis of SaaS performers found that companies sustaining Rule of 40 performance tend to lean on predictive customer health and advanced analytics to drive retention and NRR, and that sustaining that performance over time is rare.
- Operational discipline: reducing CSM intervention rate by 18% in the same simulation study shows that better targeting can free up capacity rather than just adding more alerts to a CSM's plate.
Sustained Rule of 40 performance is rare among SaaS companies, and the firms that manage it tend to rely on predictive customer health analytics to protect retention. That link between predictive work and a headline growth metric is a useful argument when a playbook program needs executive sponsorship.
Benchmarks should scale with company stage. An early-stage company with a few hundred accounts might set a modest target, like reducing time-to-action from days to hours, before chasing a specific retention percentage. A more mature company with years of historical data can set tighter precision and calibration targets. Either way, a randomized holdout, where some at-risk accounts get the new playbook and others get standard treatment, is the cleanest way to attribute a retention lift to the playbook itself rather than to a good quarter.
How Customerscore applies predictive playbooks in practice
Customerscore connects product usage, billing, CRM, and support data into a single explainable health score, so a CSM sees the reasoning behind a risk flag rather than just a number. That structure supports the kind of plays described above in a generic form: an onboarding rescue when early usage signals stall, a renewal risk alert when contract and usage signals decline together, and a downgrade-prevention sequence when billing and seat-count signals shift at once. Each play follows the same pattern, a trigger, a template, an owner, and a defined timeline, built around playbook automation rather than a static dashboard.
What most teams get wrong about predictive churn models
Most teams chase model accuracy before they have earned the right to. A model with fewer signals that CSMs actually trust beats a complex one nobody acts on. Three rules: start where your data is cleanest, pilot on your highest-impact segment first, and automate only what you would trust an intern to send unsupervised. The most common failures are overfitting to last year's churners, alert volumes nobody can act on, and skipping explainability. Run one pilot, with a holdout group and two or three KPIs, before building anything bigger.
— Patrik
How Customerscore turns prediction into practice for your team
Customerscore deploys explainable health scoring and automated playbooks in days, not months. See pricing or book a demo to talk through your data.
Sources
- Simulation enhanced early warning and intervention model for customer success in startups using value alignment — IJSPM 2026
- SaaS and the Rule of 40: Keys to the critical value creation metric — McKinsey
- Optimizing Customer Success: An analytics tool for customer success management — DIVA portal
FAQ
What is a playbook in SaaS customer success?
A playbook is a repeatable, predefined set of actions a customer success team takes in response to a specific trigger, such as a churn risk signal or an onboarding milestone. It pairs a condition (the trigger) with a template action, an owner, and a timeline, so the response happens the same way every time rather than depending on individual judgment.
What is the Rule of 40 in SaaS?
The Rule of 40 is a benchmark where a SaaS company's growth rate plus its profit margin should add up to 40% or more. McKinsey's analysis found that sustaining this performance over time is rare, and that the companies that manage it tend to invest in predictive customer analytics to protect retention.
What is the 3-3-2-2-2 rule of SaaS?
This is a growth-benchmarking framework some SaaS commentators use to describe expected year-over-year growth multiples at different revenue stages, though definitions of the exact figures vary across sources. It is not a standardized metric with one official definition, so treat any specific numbers attached to it with caution.
Is ChatGPT a SaaS?
ChatGPT is delivered as a cloud-based subscription product accessed through a browser or app, which fits the general definition of software as a service. It is a general-purpose AI assistant rather than a customer success or churn-prediction tool, so it is not built for the playbook use cases described in this article.
How do predictive playbooks differ from a static health score?
A static health score just reports a number or status on a dashboard, with no defined next step attached to it. A predictive playbook ties that score to a trigger, a specific intervention, an owner, and a timeline, so the prediction actually leads to an action rather than sitting unused.
Recommended
Related articles
Pinpoint B2B SaaS Adoption Gaps and the Fix That Lifts Renewal
Pinpoint B2B SaaS Adoption Gaps and the Fix That Lifts Renewal ! Analysts reviewing SaaS adoption gaps Adoption gap analysis identifies the funnel stage where eligible users or accounts fail to reach
BlogAnalysts: 6–12 Month Cohort Forecasts for Net Dollar Retention
Analysts: 6–12 Month Cohort Forecasts for Net Dollar Retention ! Analyst reviewing cohort retention forecast The most reliable way to forecast net dollar retention is cohort-based modeling that
BlogStop Surprise Churn: 5 Phase Data Mapping for RevOps and CS
Stop Surprise Churn: 5 Phase Data Mapping for RevOps and CS ! Analyst mapping customer data fields Data mapping for CS means connecting product usage, billing, CRM, and support data to the fields your
BlogFix Data First: Prioritize CS Integrations With a 90 Day Pilot
Fix Data First: Prioritize CS Integrations With a 90 Day Pilot ! Engineer validating SaaS integration data Prioritize integrations that sharpen predictive signals and close the loop for CSMs, not the