
Pinpoint B2B SaaS Adoption Gaps and the Fix That Lifts Renewal


Adoption gap analysis identifies the funnel stage where eligible users or accounts fail to reach retention-predictive milestones, so you can prioritize fixes that lift renewal and expansion. The core measurement frame is a four-stage funnel (exposed, activated, completed workflow, used again) paired with retention data. Run it well and you should walk away with the exact stage where accounts stall and one prioritized fix with a projected retention lift attached.
TL;DR:
- Adoption gap analysis should focus on identifying drop-offs at each of the four funnel stages using correct denominators and segmentation to ensure accurate diagnosis.
- Upstream issues such as discoverability and activation friction typically cause early-stage drops, while value and retention gaps are linked to subsequent hurdles like insufficient repeat use.
- Validating fixes through matched cohort comparisons and quarterly rechecks prevents misleading results caused by selection bias or shifting customer bases.
- Tracking account-level KPIs like seat coverage and multi-user activation provides more reliable renewal signals than individual user activity alone.
- Automating the analysis with integrated data sources and playbooks streamlines diagnosing and addressing adoption barriers, saving manual effort and improving retention outcomes.
Table of Contents
- The four-stage feature funnel and the metrics that matter
- Step-by-step: run an adoption gap analysis
- Diagnosing failure modes and matching them to fixes
- Validating impact with cohort methods and attribution
- Operationalizing account-level and user-level adoption signals
- How Customerscore supports adoption gap analysis in practice
- Practitioner perspective: pitfalls to avoid and three quick wins
- Put adoption gap analysis into a working system
- Sources
- FAQ
The four-stage feature funnel and the metrics that matter
A useful adoption gap analysis rests on a four-stage feature funnel: exposed, activated, completed workflow, and used again. Exposed accounts have seen or could see the feature. Activated accounts have tried it once. Completed workflow means they finished the task the feature was built for. Used again is the real signal: repeated, value-driven behavior rather than a single trial run, since a one-time click is not the same thing as adoption.
Each stage needs its own metric, and the denominator matters as much as the number:
- Feature adoption rate: completions divided by eligible users, not total users, since inflating the denominator with accounts that never had the feature exposed hides the real gap.
- Breadth: how many distinct features or workflows an account has adopted, useful for spotting shallow usage.
- Activation rate: first successful use divided by eligible users who were exposed.
- Time-to-value (TTV): how long it takes a new account to complete its first meaningful workflow.
- Workflow conversion: the percentage who convert from activated to completed workflow.
- Stickiness: the share of completers who return and use the feature again within a defined window.
None of these numbers means much without segmentation by plan tier, acquisition motion, industry, and cohort, since a blended average across a self-serve tier and an enterprise tier will mask both a strength and a weakness.
Step-by-step: run an adoption gap analysis
Running the analysis is a sequence, not a dashboard you glance at once.
- Define the eligible population and the retention-predictive milestones you care about, such as completing a core workflow within the first 30 days.
- Instrument the events that mark each funnel stage and build the funnel at the user level first.
- Aggregate to the account level, since B2B renewal and expansion decisions are made per account, not per user.
- Segment into like-for-like cohorts (plan tier, acquisition motion, industry, customer age) and compare each against a benchmark.
- Calculate the gap at each stage and rank fixes by retention lift potential weighted against feasibility.
- Design an experiment or guidance intervention for the top-ranked gap, with a success metric defined before you launch.
Time-to-value and activation rate are two of the more consistently useful measures to instrument first, since they tend to surface upstream problems that ripple into every later stage. Measuring TTV and activation rate correctly early in the process saves you from re-running the whole funnel later.
Pro Tip: Build the account-level rollup before you segment. Segmenting user-level data first tends to produce cohorts that look healthy individually but hide a churn-risk account underneath.
Diagnosing failure modes and matching them to fixes
Where accounts drop in the funnel tells you what kind of problem you have. A large exposed-to-activated gap usually points to discoverability. Activated-to-completed drop-off tends to mean friction inside the workflow itself. Completed-but-not-used-again is a value or retention signal, meaning the feature worked once but did not earn a repeat visit.
Behavioral signals help distinguish friction from a genuine value failure. Clustered drop-off at a specific screen or step, paired with error events or repeated retries, points to friction. Clean, error-free completions that simply never recur point to a value problem instead, meaning the feature did what it promised but the promise was not compelling enough to repeat.
Match the diagnosis to the fix:
- Discoverability gap: surface the feature earlier or more visibly in the account's workflow.
- Activation friction: simplify the first-use flow or remove unnecessary steps.
- Value delivery gap: reposition the feature around the outcome it actually produces, not the mechanism.
- Retention gap: build role-based onboarding and account-level enablement so more than one person at the account depends on the feature.
Onboarding playbooks built around these four fix types tend to outperform generic "improve engagement" initiatives because they target a specific stage rather than the whole funnel at once.
Validating impact with cohort methods and attribution
Identifying a gap is not the same as proving a fix worked. A matched cohort pre/post comparison is the standard method: match accounts on lifecycle stage and eligibility, then compare retention and expansion before and after the intervention against a control group that did not receive it.
- Match on lifecycle stage and eligibility so you are comparing accounts at similar points in their journey, not new signups against three-year renewals.
- Watch for confounders and selection bias, such as an intervention that only reached your most engaged accounts, which will inflate the apparent lift.
- Use bootstrapped confidence intervals when experiment traffic is limited, rather than declaring a result significant off a handful of accounts.
- Recheck the retention correlation quarterly, since a fix that worked in one quarter can decay as the product or the customer base shifts.
A small, real lift on a well-matched cohort is worth more to the business case than a large, unverified lift on an unmatched comparison.
Operationalizing account-level and user-level adoption signals
B2B renewal decisions are made at the account level, so the operational layer needs account-level KPIs even though the underlying events are user-level. Track seat coverage (the share of licensed seats actively using the product), multi-user activation (accounts with two or more active users completing core workflows), and an account adoption score that rolls these up. Account-level adoption tends to predict renewal and expansion better than any single user's engagement, and accounts under roughly 50% seat coverage are a common trigger for customer success outreach.
User-level KPIs still matter because they feed the account rollup: workflow completion rate and time-to-value at the individual level are the inputs, not the output.
- Weekly: monitor core adoption metrics and flag any account with a sudden drop.
- Automated alerts: trigger on adoption drops greater than 5 percentage points.
- Monthly: attribute intervention impact to specific playbooks or product changes.
- Quarterly: revalidate the retention correlation to confirm the fix still holds.
Pro Tip: Route discoverability and friction gaps to product and PM experiments, but route value and retention gaps to customer success playbooks, since the latter usually need human context the product alone cannot supply.
How Customerscore supports adoption gap analysis in practice
Multi-source integration, pulling product usage, billing, CRM, and support data into one place, is essential for this kind of analysis. Explainable health scores and churn prediction can help teams identify accounts stalling in the funnel before renewal conversations start, and playbooks and onboarding workflows can turn a diagnosed gap into an assigned action rather than a spreadsheet note.
For teams building out the measurement pieces described above, Customerscore's own resources cover feature adoption mechanics and reducing churn in self-service segments in more depth.
Practitioner perspective: pitfalls to avoid and three quick wins
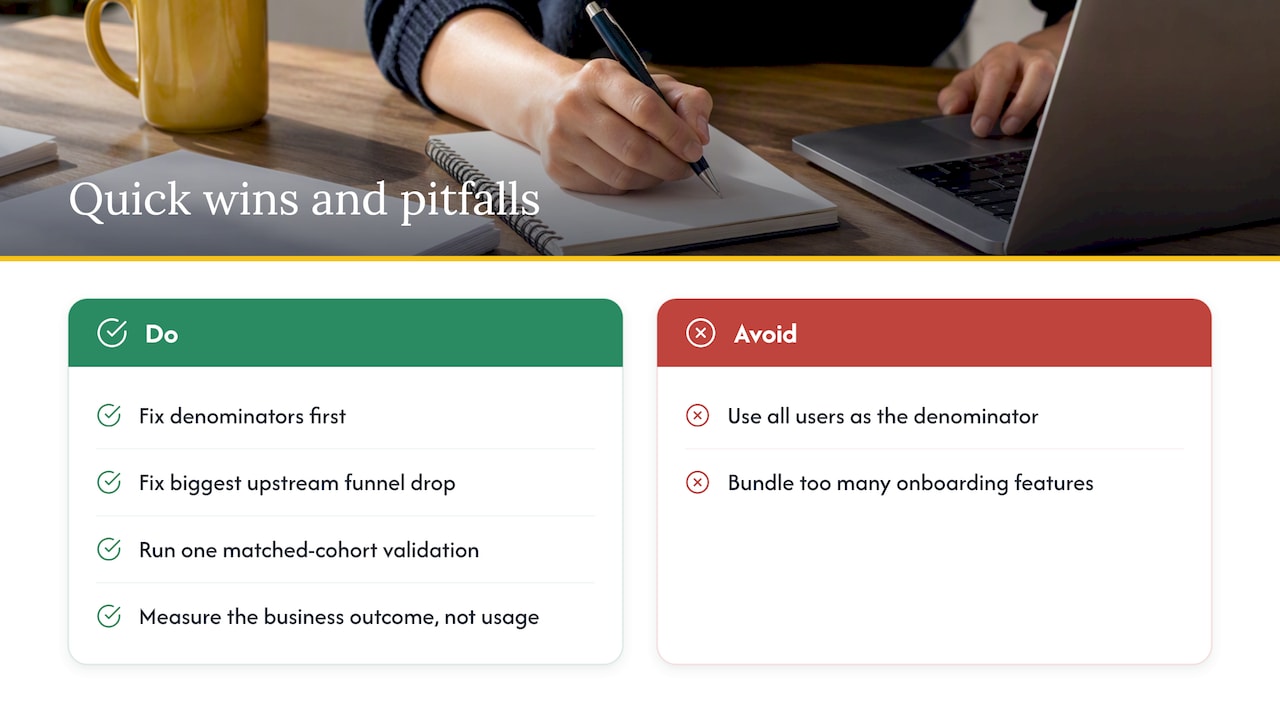
The most common mistake I see is using the wrong denominator, counting all users instead of eligible ones, which makes adoption look worse or better than it is. A close second is bundling too many features into onboarding at once, which adds perceived complexity and can drag retention down rather than up.
Three quick wins: fix your denominators first, find and fix the single biggest upstream funnel drop before touching anything downstream, and run one matched cohort validation before you scale a fix. Measure the business outcome the fix was supposed to move, not just whether usage ticked up.
— Patrik
Put adoption gap analysis into a working system
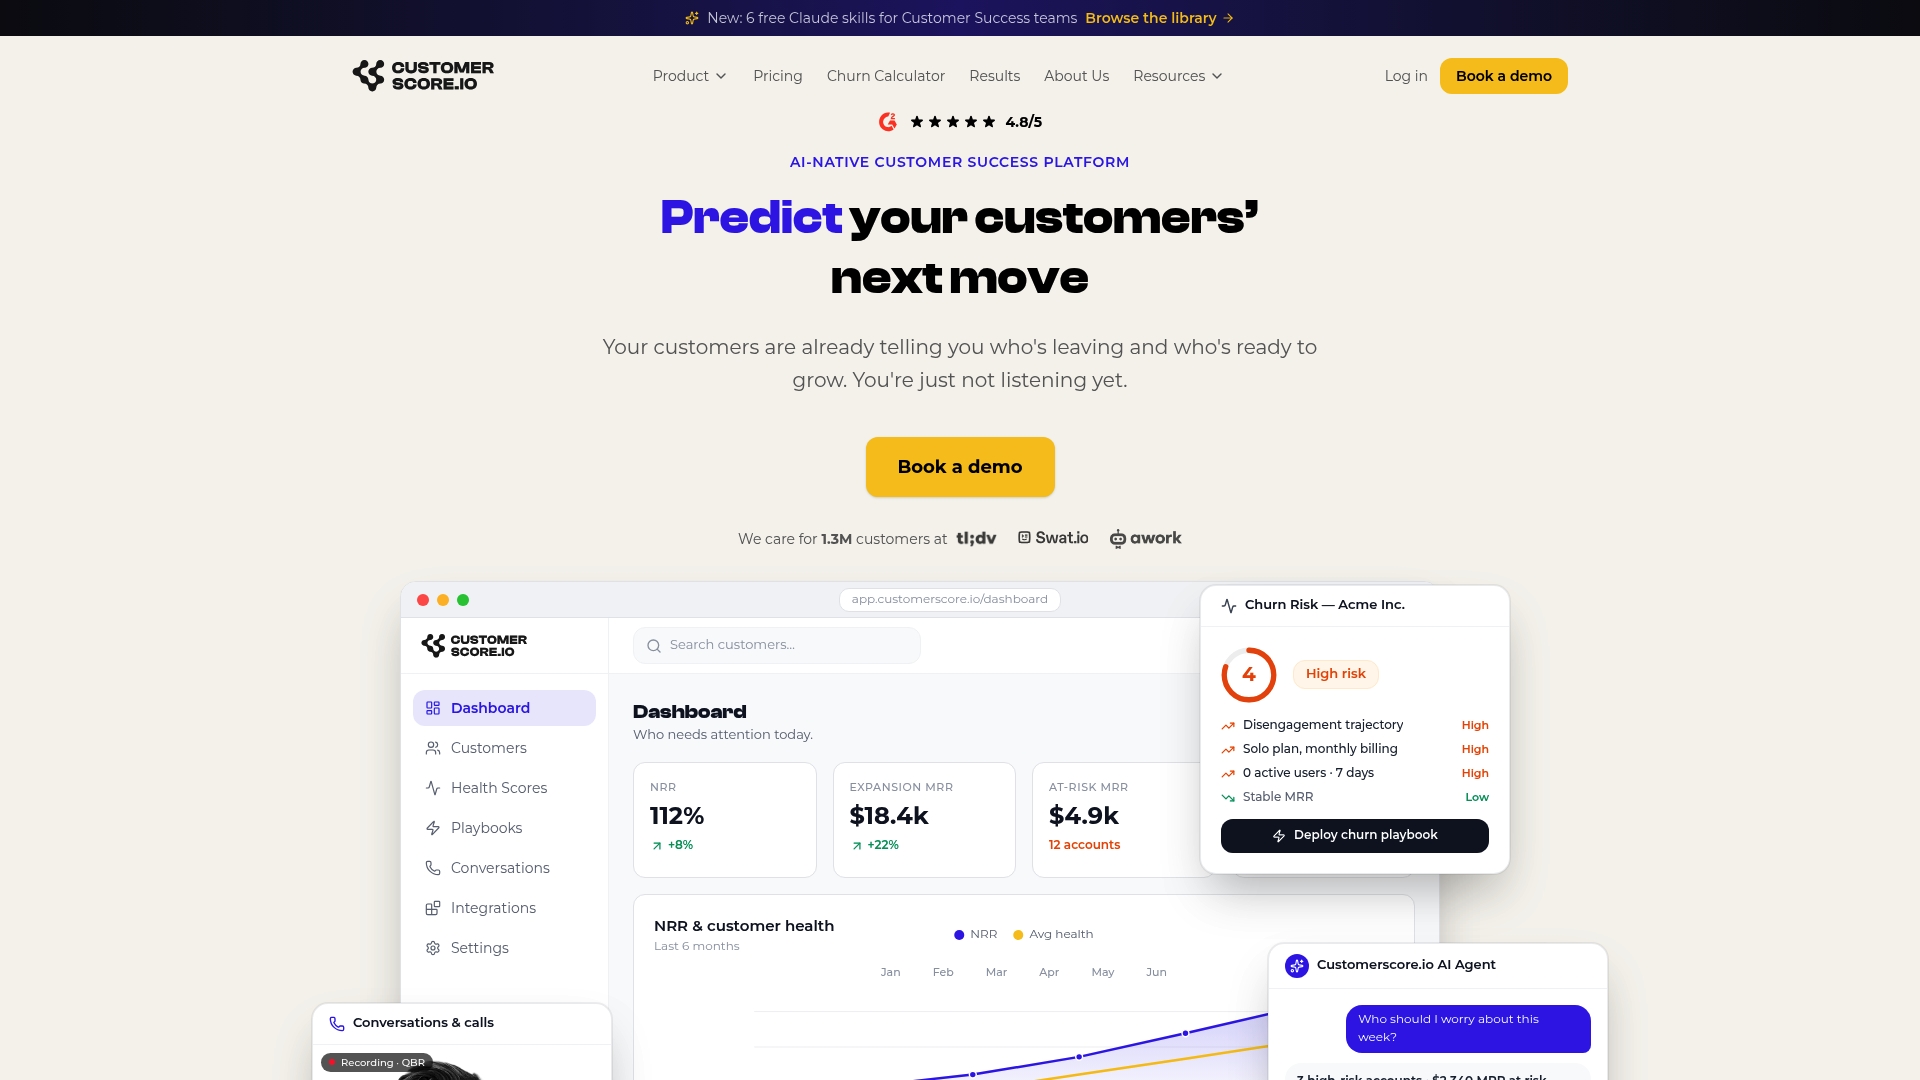
Diagnosing an adoption gap by hand, quarter after quarter, is manual work most CS and RevOps teams do not have spare hours for. Customerscore automates the churn prediction, health scoring, and playbook triggers this article describes, connecting to billing, product usage, CRM, and support data so the funnel stages and account-level scores update without a rebuilt spreadsheet each time.
- Explainable health scores tied to the same adoption signals covered above.
- Automated playbooks that route discoverability, friction, and retention gaps to the right team.
- Native integrations with HubSpot, Salesforce, Stripe, Mixpanel, PostHog, Segment, Chargebee, Intercom, and Slack.
Customerscore charges a flat platform fee tiered by your client ARR, never per seat, with a quote in one call. If you want a walkthrough of how it would apply to your funnel, book a demo.
Sources
This article draws on the feature adoption funnel framework, benchmarking guidance by segment, peer-reviewed research on onboarding complexity, and SaaS activation rate benchmarks, along with a partner perspective on retention strategy.
- How to measure feature adoption: a complete framework for product teams
- Conducting effective benchmarking analysis: a step-by-step guide
- Peer-reviewed study on add-on bundling and onboarding retention
FAQ
What is adoption gap analysis in B2B SaaS?
It is the process of measuring where eligible users or accounts drop out of a feature adoption funnel before they reach the milestones tied to retention, then prioritizing fixes at that stage. It relies on eligible-user denominators and cohort comparisons rather than raw usage counts.
How do I know if my activation rate is low?
Compare your activation rate against a like-for-like segment such as your own plan tier or acquisition motion rather than a blended company average. Industry benchmarking suggests activation rates in the mid-30s are common, and rates well below that often signal an upstream problem worth investigating first.
Should I measure adoption at the user level or the account level?
Measure both, but weight account-level signals more heavily for renewal and expansion decisions, since account-level adoption predicts renewal better than any single user's activity. User-level metrics like workflow completion still matter because they feed the account-level score.
How do I prove that fixing an adoption gap actually improved retention?
Run a matched cohort pre/post comparison, matching accounts on lifecycle stage and eligibility, then compare retention and expansion in the treated group against a control group over the same window. Recheck the correlation quarterly, since a lift that shows up in one quarter can fade as the product or customer base changes.
Does adding more features during onboarding help or hurt adoption?
It often hurts. A peer-reviewed study found that bundling more add-ons during onboarding can reduce retention because of the added perceived complexity, though richer communication can soften the effect.
Recommended
Related articles
Cut CSM Intervention 18%: Predictive Playbooks for CS & RevOps
Cut CSM Intervention 18%: Predictive Playbooks for CS & RevOps ! Predictive playbook geometric title card Predictive playbooks link a churn prediction to a specific, repeatable action so customer
BlogAnalysts: 6–12 Month Cohort Forecasts for Net Dollar Retention
Analysts: 6–12 Month Cohort Forecasts for Net Dollar Retention ! Analyst reviewing cohort retention forecast The most reliable way to forecast net dollar retention is cohort-based modeling that
BlogStop Surprise Churn: 5 Phase Data Mapping for RevOps and CS
Stop Surprise Churn: 5 Phase Data Mapping for RevOps and CS ! Analyst mapping customer data fields Data mapping for CS means connecting product usage, billing, CRM, and support data to the fields your
BlogFix Data First: Prioritize CS Integrations With a 90 Day Pilot
Fix Data First: Prioritize CS Integrations With a 90 Day Pilot ! Engineer validating SaaS integration data Prioritize integrations that sharpen predictive signals and close the loop for CSMs, not the