
SaaS Onboarding Best Practices for B2B Teams in 2026


Compress your time-to-value and define one observable activation event. Those two decisions will do more for retention than any feature release or email sequence you run this quarter. Onboarding accounts for a significant portion of churn variance, and best-in-class teams target rapid first value delivery for self-serve flows. If you can't finish the sentence "A new user is activated when they ___" with a specific, measurable action, your onboarding lacks the focus it needs.
Three things to run in the next 48–72 hours:
- Add one routing question at signup ("What's your primary goal?") and map two different next-step sequences to the answers.
- Run a smoke test on your instrumentation: fire a test signup and confirm every event from
signuptofirst_actionlands in your analytics tool. - Pick the single step where the most users drop off and run a micro-A/B test on the copy or the number of required fields.
Table of Contents
- Why onboarding is the highest-leverage feature in B2B SaaS
- Core principles that should govern every onboarding program
- Copyable playbooks for three common B2B personas
- How to instrument onboarding: KPIs, event taxonomy, and experiments
- What technology does your onboarding stack actually need?
- Realistic timeline for a 90-day onboarding overhaul
- Common onboarding mistakes and how to fix them fast
- Reusable flow diagram, event snippet, and copy templates
- Key Takeaways
- The part most teams get wrong about onboarding
- How Customerscore helps you turn onboarding signals into retained revenue
- Useful sources and further reading
Why onboarding is the highest-leverage feature in B2B SaaS
Most product teams treat onboarding as a UX polish project. It's not. It's a revenue lever.
Top-quartile PLG products hit first value in 1–7 days; top-decile products reach activation in 1–3 days. The correlation is direct: longer time-to-value means higher churn. For a $5M ARR business losing 2% more monthly than it should, fixing onboarding is worth more than hiring two additional CSMs.
Personalized onboarding based on role or intent can lift 7-day retention by as much as 35%, a key insight covered in detail in Why brands should use SaaS SEO: sustainable growth & lower costs. That's not a marginal gain. Healthy PLG products see 40–60% activation within 14 days, and users who adopt three or more features churn at roughly half the rate of single-feature users.
Core principles that should govern every onboarding program
These aren't guidelines. They're operating rules. Violate one and your metrics will tell you.
- Define activation as one observable behavior. "Completed setup" is not activation. "Sent first campaign to a real audience" is. Pick the action that predicts 90-day retention and build everything toward it.
- Minimize steps to activation. Every screen between signup and the activation event is a potential exit. Remove anything that doesn't directly contribute to reaching it.
- Route by goal, not by role title. Goal-based routing with 1–3 signup questions segments users into flows that match their intent. A developer integrating via API and a marketing manager building campaigns need completely different starting experiences.
- Instrument every user state explicitly. Treat onboarding as an operational system with behavioral triggers, not a static checklist. Know whether a user is in "signed up," "intent answered," "first action taken," or "activated" at any moment.
- Defer nonessential setup. Billing details, team invites, and advanced configuration belong after activation, not before it.
Pro Tip: Delay the team-invite prompt until a second user has completed the activation event. Sending it earlier inflates invite volume without driving actual multi-user activation, which is the signal that predicts expansion revenue.
Copyable playbooks for three common B2B personas
Behavioral email sequences triggered by actions convert at 2–3x the rate of time-based drips. The playbooks below are built around that principle.
Persona 1: Self-serve product manager
- Routing question: "What outcome matters most right now?" (options: reduce churn / improve activation / track feature adoption)
- Activation path: dashboard → create first health score or segment → view result
- Follow-up trigger: if no activation event within 24 hours, send behavioral email with one-click resume link
Persona 2: SMB marketer
- Routing question: "How do you currently track customer health?" (options: spreadsheet / CRM only / no system)
- Activation path: connect one data source → view auto-generated health score
- Follow-up trigger: if data source connected but no score viewed within 48 hours, in-app nudge with a short video
Persona 3: Technical integrator
- Routing question: "Which stack are you connecting?" (options: HubSpot / Salesforce / Stripe / other)
- Activation path: API key generated → first event received → integration verified
- Follow-up trigger: if no event received within 6 hours, Slack or email with a code snippet for the detected stack
Implementation checklist:
- Welcome screen microcopy: "Let's get you to your first insight in under 5 minutes."
- Progress badge label: "Step 2 of 3: Connect your data"
- Skip button label: "I'll do this later" (never "Skip" alone — it implies the step matters less than it does)
- Behavioral email subject line: "You're one step from your first health score"
Checklists work only when each item maps to a behavior that predicts retention. Keep them to 3–5 items and update them dynamically based on what the user has already completed.
Pro Tip: When a user's routing answer signals high technical sophistication (e.g., "I have an existing data pipeline"), skip the guided walkthrough entirely and drop them directly into the API docs or integration screen. Forcing an experienced user through a beginner tour is a fast path to abandonment.
How to instrument onboarding: KPIs, event taxonomy, and experiments
Core metrics to track
| Metric | Definition | Target |
|---|---|---|
| Activation rate | % of signups who complete the activation event | 40–60% within 14 days |
| Time-to-value (median) | Median time from signup to activation event | Under 5 minutes (self-serve) |
| Step completion rate | % completing each onboarding step | Identify any step below 60% |
| Day-7 retention | % of activated users still active on day 7 | Benchmark against cohort baseline |
| Team expansion signal | Second user activated within 30 days | Predicts account expansion |
Event taxonomy
signup → intent_answered → first_action → activation_event → invite_sent → second_user_active
Each event should capture: user_id, timestamp, persona_segment, routing_answer, and session_id. That's the minimum to run cohort analysis by persona and identify where each segment drops off.
Experiment checklist
- Step removal A/B: Remove one required field or step from the activation path. Run until you have at least 200 completions per variant before reading results.
- Cohort analysis cadence: Pull weekly cohorts by signup date and routing answer. Compare activation rates across persona segments every two weeks.
- Behavioral trigger timing: Test sending the first follow-up email at 2 hours vs. 24 hours post-signup for users who haven't activated.
Pro Tip: When analytics bandwidth is limited, instrument the activation event and the single step with the highest drop-off first. Everything else can wait.
What technology does your onboarding stack actually need?
The integration map below covers the standard system roles. Every tool in your stack should provide real-time events, user-level mapping, webhook support, and two-way sync with at least one adjacent system.

| System role | Tools | What it must provide |
|---|---|---|
| Product analytics | Mixpanel, PostHog | Event stream, funnel analysis, cohort segmentation |
| Event pipeline | Segment | Unified user identity, routing to downstream tools |
| CRM | HubSpot, Salesforce | Account context, CS ownership, lifecycle stage sync |
| Billing | Stripe, Chargebee | Subscription state, trial expiry, upgrade signals |
| Messaging & support | Intercom, Slack | In-app messaging, behavioral triggers, live chat |
| CS platform | Customerscore | Health scoring, churn prediction, playbook execution |
Selection criteria to apply:
- Data latency under 60 seconds for behavioral triggers to fire in-session
- User identity ownership: one system must be the source of truth for
user_idacross all tools - Pricing model that doesn't penalize event volume (flat or ARR-based beats per-event billing at scale)
- Ease of instrumentation: how many engineering hours to add a new event property?
For teams evaluating client onboarding software, the decision usually comes down to whether the tool can act on signals in real time or only report on them after the fact.
Realistic timeline for a 90-day onboarding overhaul
- Discovery (weeks 1–2): Map current user states, pull step-level conversion data, run five user interviews with recently churned accounts. Owner: CS lead + product manager.
- Build (weeks 3–10): Implement routing questions, rebuild activation path, create persona-specific email sequences. Owner: product engineer + copywriter. Effort: 2–4 engineering sprints.
- Instrumentation and A/B (weeks 5–10, overlapping): Deploy event taxonomy, configure analytics dashboards, launch first step-removal A/B test. Owner: analytics engineer + CS lead.
- Rollout and iterate (week 11 onward): Ship to 100% of new signups, run biweekly cohort reviews, iterate on the lowest-performing persona segment first.
Primary cost drivers: data plumbing (connecting billing + CRM + product analytics into one identity graph), enterprise SSO integration, and custom UX for persona-specific flows. The mitigation for all three is sequencing: get the activation event instrumented and the routing question live before touching any of the custom UX work.
Common onboarding mistakes and how to fix them fast
The five most common failures:
- Front-loading friction: requiring billing, team setup, or profile completion before the activation event
- Checklist-as-feature-tour: listing every capability instead of the 3–5 steps that predict retention
- Uninstrumented onboarding: no step-level events, no way to diagnose drop-off
- One-size-fits-all flows: same experience for a developer and a non-technical manager
- Too many required fields at signup: more than three fields before the user sees the product
Red-flag signals that need immediate action:
- Activation rate below 30%
- More than 60% of users dropping at a single step
- Day-7 retention significantly below your cohort baseline
- Zero behavioral triggers firing (instrumentation gap)
48-hour triage process:
- Pull step-level conversion for the last 30 days. Identify the single biggest drop-off point.
- Watch session replays of users who dropped at that step. Look for rage clicks, hesitation, or confusion before making any copy changes.
- Interview three users who signed up but never activated. Ask what they expected to happen next.
Front-loading friction is the most common failure, and it's also the fastest to fix: move one administrative step to post-activation and measure the change in completion rate within a week.
Reusable flow diagram, event snippet, and copy templates
The orient → activate → expand pattern
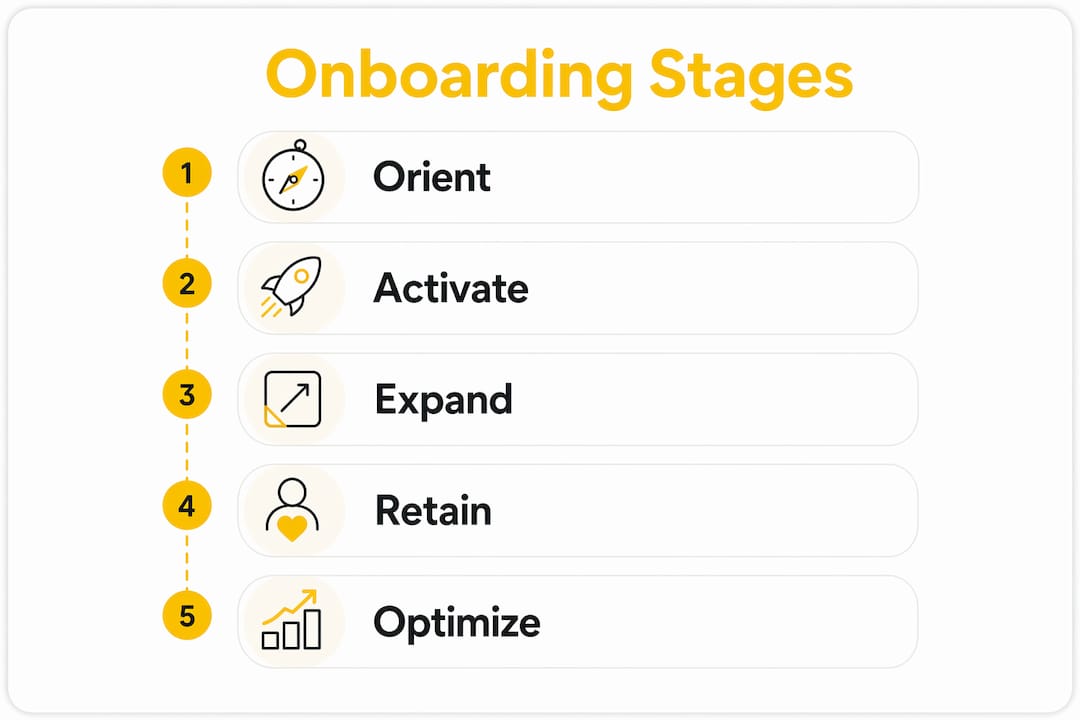
Every B2B SaaS onboarding flow maps to three phases. The Orient phase runs from signup to roughly 60 seconds in: the user understands what to do next. Activate runs from 2–15 minutes for self-serve: the user completes the activation event. Expand runs from day 2 through day 30: the user discovers adjacent value and invites teammates.
Insert routing questions at the end of Orient, before the user enters the Activate phase. Insert team-invite prompts at the start of Expand, after the activation event fires.
Event taxonomy snippet
| Event name | Key properties |
|---|---|
signup | user_id, source, plan_type |
intent_answered | user_id, routing_answer, persona_segment |
first_action | user_id, action_type, session_id |
activation_event | user_id, time_to_activate_seconds, persona_segment |
invite_sent | user_id, invitee_email, days_since_signup |
second_user_active | account_id, days_to_second_user |
Microcopy examples
- Welcome screen H1: "Your first insight is 3 steps away."
- Progress indicator: "2 of 3 complete — you're almost there."
- Behavioral email subject (non-activator, 24h): "Still getting set up? Here's the one thing to do first."
- Post-activation in-app message: "You're in. Want to invite your team?"
Key Takeaways
Effective SaaS onboarding requires a defined activation event, sub-five-minute time-to-value, goal-based routing, step-level instrumentation, and continuous experimentation — in that order of priority.
| Point | Details |
|---|---|
| Define activation first | Pick one observable user behavior that predicts 90-day retention before building any onboarding logic. |
| Target under 5 minutes TTV | Top-decile PLG products reach activation in 1–3 days; self-serve flows should aim for under 5 minutes to first value. |
| Route by goal at signup | One to three qualifying questions at signup lifts 7-day retention by up to 35% through persona-specific paths. |
| Instrument step-level events | Track the full taxonomy from signup to second_user_active; watch session replays before changing any copy. |
| Customerscore for CS operations | Customerscore connects onboarding signals to health scoring and churn prediction, closing the loop from activation to renewal. |
The part most teams get wrong about onboarding
Most CS and RevOps leaders I talk to treat onboarding as a one-time build. Ship the product tour, write the welcome email sequence, hand it off to the product team, and move on. That framing is the root cause of most activation problems.
Onboarding is an operational system. It has states, transitions, and failure modes, exactly like a sales pipeline or a support queue. The teams that consistently hit 50%+ activation rates are the ones running biweekly cohort reviews, maintaining a live event taxonomy, and treating a drop in activation rate the same way they'd treat a spike in support tickets: as an operational signal that requires a response, not a design refresh.
The GoodAccess case study on CS efficiency is a concrete example of what changes when you apply this framing. Connecting onboarding signals to health scoring and churn prediction turned reactive CS work into a proactive system. That's the shift worth pursuing.
How Customerscore helps you turn onboarding signals into retained revenue
If your onboarding improvements are generating activation data but that data isn't connected to churn risk or expansion signals, you're leaving the most valuable part of the work on the table. Customerscore pulls together billing data from Stripe and Chargebee, product usage from Mixpanel and PostHog, CRM context from HubSpot and Salesforce, and support signals from Intercom into a single health score that updates in real time.
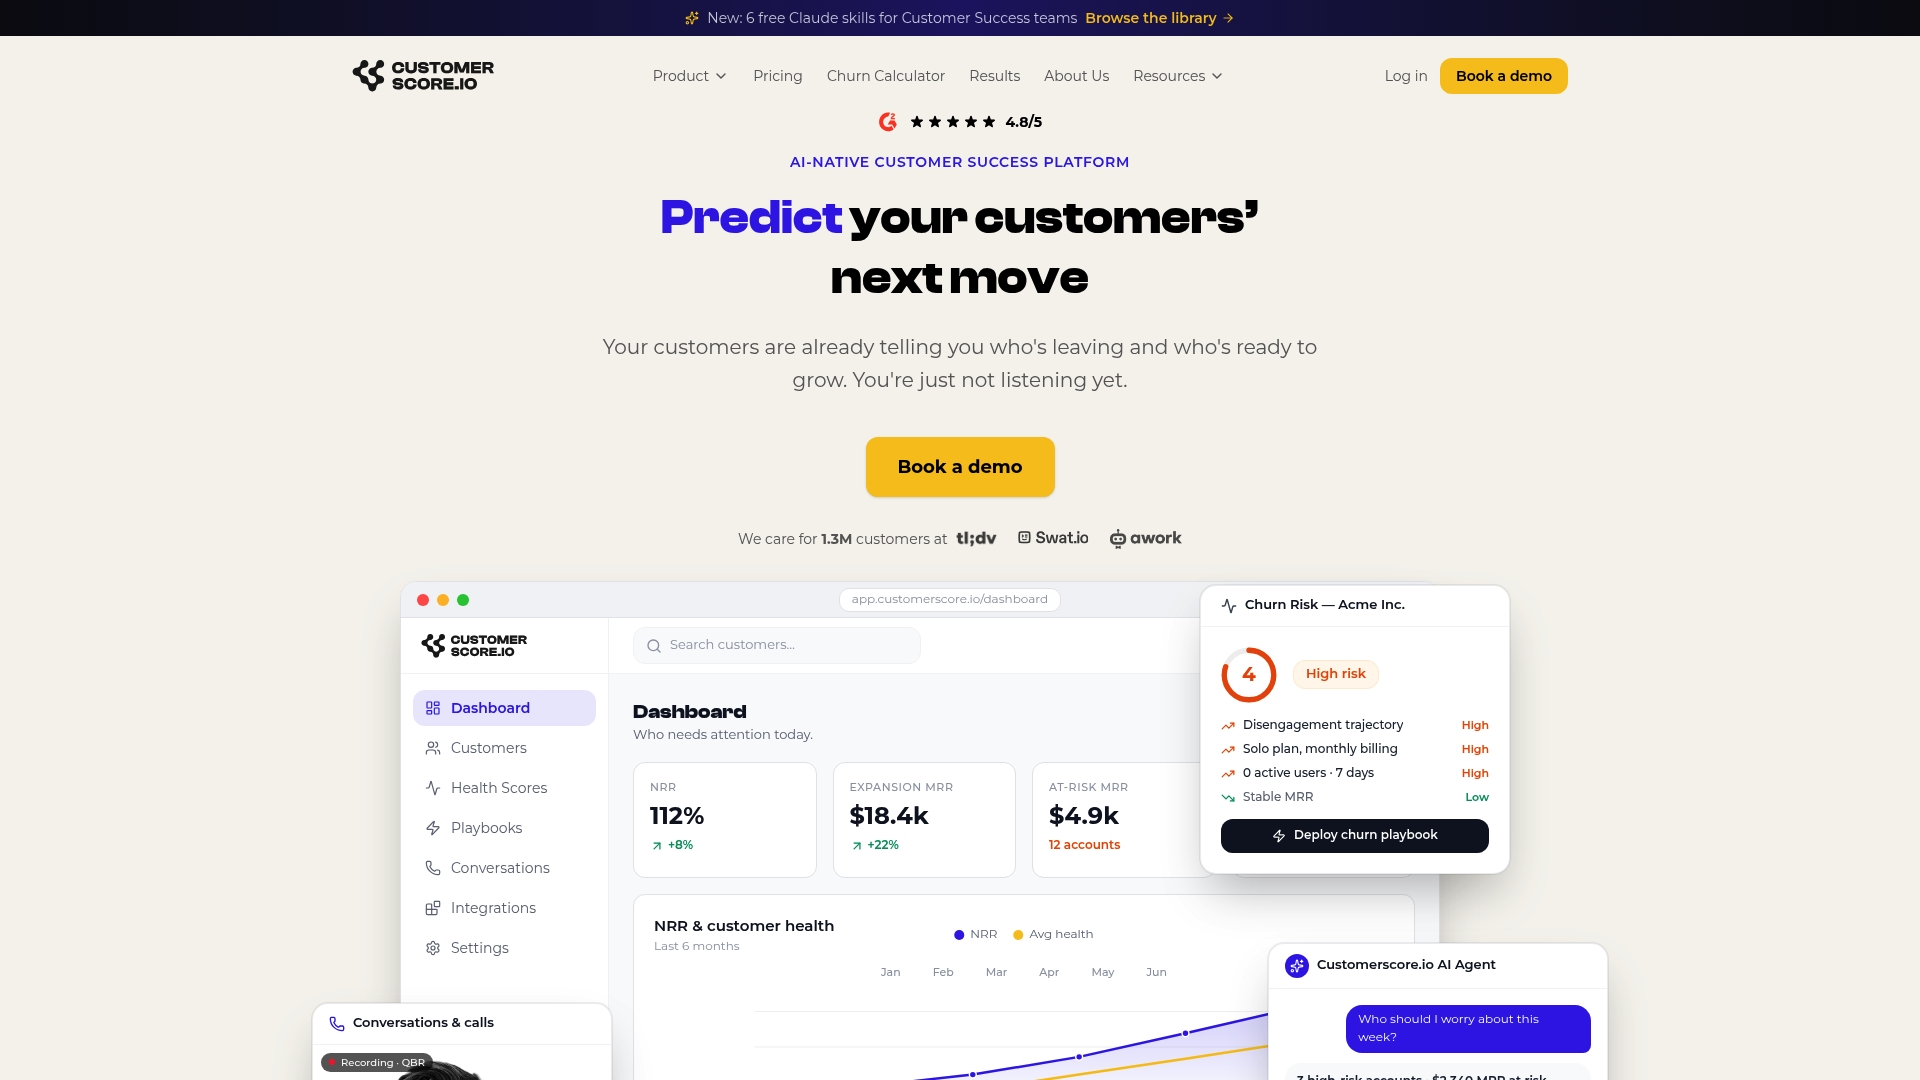
The Customer Rooms feature gives each account a structured onboarding space where CS teams can track progress, surface blockers, and trigger playbooks without switching between five tools. When a new user stalls at the activation event, Customerscore flags it before the CSM's next check-in. When a second user activates, it triggers the expansion playbook automatically.
For teams that want churn prediction tied directly to onboarding behavior, the AI churn prediction model uses activation signals as leading indicators, not lagging ones. Book a demo to see how it maps to your current onboarding flow.
Useful sources and further reading
- SaaS Onboarding: Best Practices & Examples — Covers the 5-stage framework, 12 product examples, and the onboarding checklist referenced in the playbooks section. Strong on activation milestone definition.
- The Complete Guide to SaaS User Onboarding in 2026 — Source for goal-based routing principles and the front-loading friction finding used in the pitfalls section.
- SaaS Onboarding Best Practices (DesignRevision) — Backs the 30–50% churn variance statistic and the 35% retention lift from personalization.
- SaaS Onboarding Best Practices (PepperEffect) — Source for treating onboarding as an operational system and the 2–3x behavioral email conversion finding.
- SaaS Onboarding UX: Boost Activation Rates in 2026 — Defines the Orient → Activate → Expand phase model and key metric definitions.
- The Masterly: SaaS Onboarding UX Guide — Source for top-quartile TTV benchmarks (1–7 days) and the dynamic checklist research.
- SaaS User Onboarding: Best Practices to Improve Adoption — Backs the session replay diagnostic approach in the pitfalls section.
- 10 SaaS Onboarding Best Practices (HubSpot) — Practitioner perspective on connecting sales handoff to onboarding and delivering value immediately.
- How to reduce churn in self-service SaaS — Customerscore's own analysis of how onboarding improvements translate to retention gains in self-serve products.
- SaaS retention: 44,000-user study — Data-driven retention benchmarks that contextualize the activation rate targets in the metrics section.
Recommended
Related articles
The SaaS Onboarding Checklist for Product Managers & CS
The SaaS Onboarding Checklist for Product Managers & CS ! Hands arranging onboarding tokens and cables A high-impact SaaS onboarding checklist is a phase-by-phase set of prioritized tasks that moves a
Blog90–120 Day Renewal System for CSMs: SaaS Renewal Playbook
90–120 Day Renewal System for CSMs: SaaS Renewal Playbook ! Team planning a structured SaaS renewal Run renewals as a 90 to 120 day managed pipeline, not a calendar reminder.
BlogCut Response Time 60% with This Slack for Customer Success Playbook
Cut Response Time 60% with This Slack for Customer Success Playbook ! Customer success team routing a Slack conversation Slack works best for customer success when it functions as the conversation
BlogProduct Led Customer Success in 90 to 180 Days Without a Data Team
Product Led Customer Success in 90 to 180 Days Without a Data Team ! Customer success operator reviewing product signals Product-led customer success uses product usage data and in-product