
How Accurate Is Churn Prediction? What Data on 48,000 B2B SaaS Customers Shows

Every customer success platform promises to tell you which customers are about to leave. Very few show whether their scores actually work. So we checked ours.
We took the risk scores Customerscore.io gave B2B SaaS customers during 2026 and compared them with what happened to those customers in the following 60 days: did they stay or leave? We did it for two kinds of scores: an AI score that predicts churn, and a rule-based health score that each company sets up itself.
Key findings
- Customers with the highest AI risk score churn 31 times more often than customers with the lowest. The Churn Risk Score runs from 1 (lowest risk) to 5 (highest risk). Within 60 days, 1 in 6 customers at score 5 leaves, against 1 in 200 at score 1.
- The AI score separates churn more sharply than a rule-based health score. The worst health score band churns 12 times more often than the best. Both scores put a similar share of customers into their highest and lowest groups, so the difference comes from accuracy, not from how the groups are cut.
- Risk hides inside the account. Companies where nobody actively uses the product churn 3.5 times more often, and companies without a healthy champion 3.3 times more often.
How we measured it
We recorded every customer's scores twice a month, on the 1st and the 15th, and checked whether the customer left in the next 60 days.
- The Churn Risk Score is the AI score from 1 (lowest risk) to 5 (highest risk). Data: 13,259 customers, March to October 2026.
- The health score is the rule-based score each company configures, from −100 (worst) to 100 (best). Data: 48,474 customers, January to October 2026.
- We left out customers who had already cancelled. When the reason for a high score is that the customer has already given notice, the team knows that without any model, and counting those customers would make the results look better than they are.
All companies are B2B SaaS and stay anonymous. Full details are in the methodology section at the end.
1. How accurate is the AI Churn Risk Score?
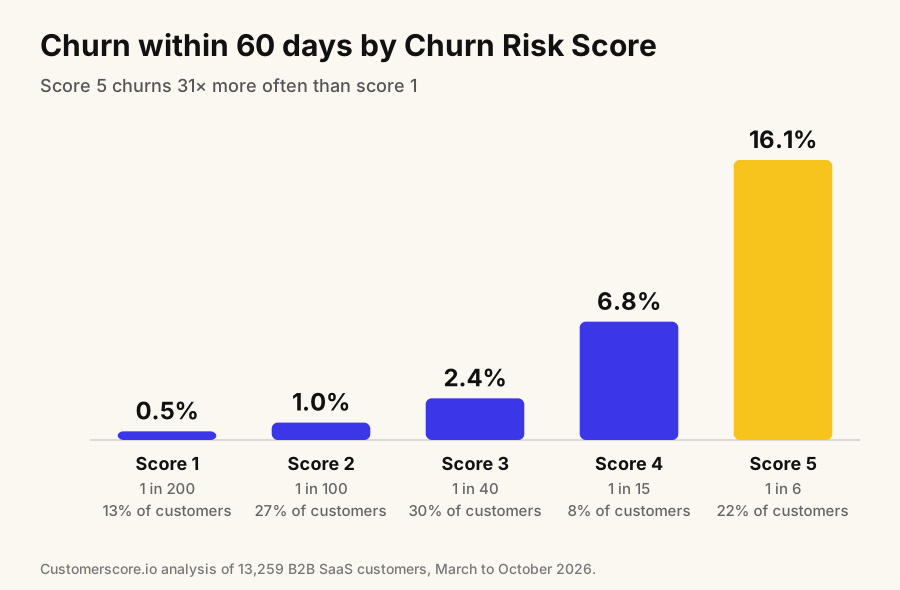
| Churn Risk Score | Share of customers | Churned within 60 days | Roughly |
|---|---|---|---|
| 1 (lowest risk) | 13% | 0.5% | 1 in 200 |
| 2 | 27% | 1.0% | 1 in 100 |
| 3 | 30% | 2.4% | 1 in 40 |
| 4 | 8% | 6.8% | 1 in 15 |
| 5 (highest risk) | 22% | 16.1% | 1 in 6 |
13,259 customers, March to October 2026.
Each step up the scale roughly doubles to triples the churn rate, and customers at score 5 churn 31 times more often than customers at score 1. That is what a calibrated score looks like: the number means something at every level, not only at the top.
A score of 5 is not a verdict. Five out of six customers at that level are still customers two months later. Treat the score as a priority order: it tells your team where its time is most likely to change the outcome.
2. AI score vs. rule-based health score
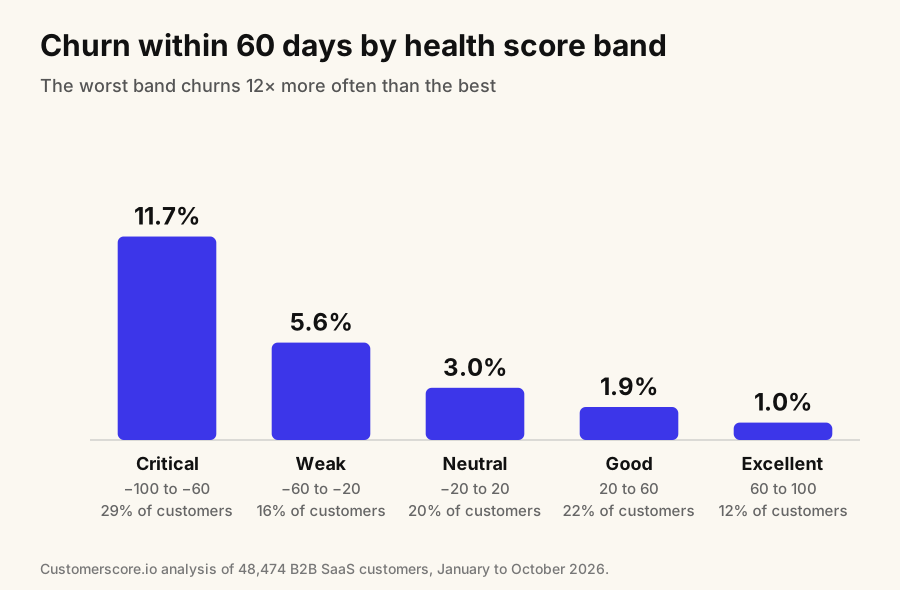
| Health score band | Share of customers | Churned within 60 days |
|---|---|---|
| Critical (−100 to −60) | 29% | 11.7% |
| Weak (−60 to −20) | 16% | 5.6% |
| Neutral (−20 to 20) | 20% | 3.0% |
| Good (20 to 60) | 22% | 1.9% |
| Excellent (60 to 100) | 12% | 1.0% |
48,474 customers, January to October 2026.
A rule-based health score works: customers in the worst band churn 12 times more often than those in the best. But the AI score separates churn more sharply, 31 times between its lowest and highest level.
The comparison is fair because both scores put a similar share of customers at their extremes: about a quarter in the worst group (22% at Churn Risk Score 5, 29% in the critical health band) and about an eighth in the best (13% at score 1, 12% in the excellent band). With groups of similar size, the steeper ladder means the AI score sorts customers by risk more accurately.
The reason is how each score is built. A rule-based score uses the metrics and weights someone chose, the same for every customer. A predictive score learns from which customers actually churned and compares each account with its own history. Our guide to building a customer health score explains both approaches.
3. Risk that hides inside the account
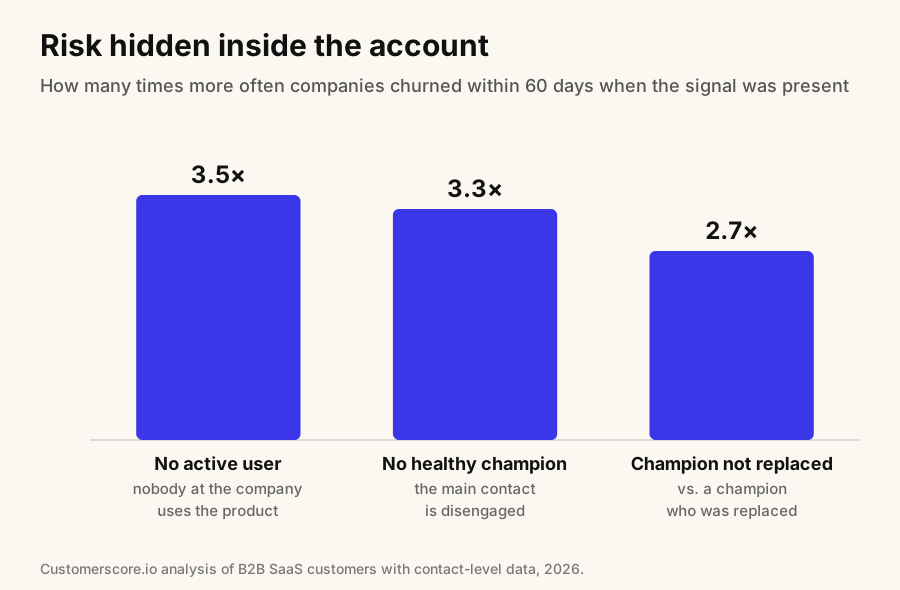
Scores look at the account as a whole. Some of the strongest warning signs sit one level lower, with the people who use the product:
- Nobody actively uses the product: 3.5 times more churn. Someone may still pay the invoices, but nobody at the company works in the product any more.
- No healthy champion: 3.3 times more churn. The main contact is disengaged, even when other people at the company still use the product.
- A champion leaves and nobody replaces them: 2.7 times worse than when the champion is replaced. A replacement on its own does not raise the risk. The danger is the empty seat, not the change of person.
These signals are easy to miss on an account-level dashboard, so it pays to watch the key people at each account, not only the account's totals.
What this means for CS teams
- Use the score as a priority order, not a forecast. Start each week with the customers at the top of the risk scale and the ones that just moved up.
- Prefer a score that learns from your churned customers. A predictive score sorts customers by risk more accurately than fixed rules.
- Watch people, not only accounts. Track whether someone at each account still uses the product and whether the champion is still there.
- Test your own score. Compare past scores with what actually happened. If the worst-scored customers do not churn clearly more often than the best-scored ones, the score needs work.
Limits of this analysis
- Correlation, not causation. We show which customers churned more often, not what caused it. Some customers with a high score may have stayed because the team stepped in.
- The window is 60 days. Longer windows would show higher churn at every level.
Methodology
Data. Anonymized customer-level data from B2B SaaS companies using Customerscore.io, January to October 2026: product usage, billing, CRM and support data, plus the scores the platform calculated.
Snapshots. Scores and attributes were recorded on the 1st and 15th of each month. Historical attribute values were rebuilt from change logs. Because a change to a company's health score setup recalculates the score for the past, we used only the period after each company's last setup change.
Outcome. Churn means the customer left within 60 days of the snapshot.
Exclusions.
- Demo and test accounts.
- Days on which a company recorded churn in bulk, for example about 2,000 customers dated to a single day.
- Scores that were calculated retroactively.
- Customers whose high score was explained by a cancellation that had already happened. We identified these from the reasons the model gives, such as "non-renewing" or "subscription cancelled", which is an approximation.
Comparisons. Every result compares groups of customers within the same company. We report medians across companies, with each company weighted equally, rather than one pooled average, because a few large customer bases would otherwise dominate the result. Shares of customers per score level are the average distribution at a point in time.
How Customerscore.io works with these signals
Customerscore.io gives every account a Churn Risk Score from 1 to 5 and an Upsell Score from 1 to 3, refreshed daily, with the reasons behind each score, and lets you run your own rule-based health score alongside it. My Day shows each CSM which accounts need them today and why, and playbooks turn a flagged account into tasks with an owner and a due date. Setup is done with the team behind the scoring engine, and most teams are live in 1 to 3 weeks.
To see how it works, book a demo.
FAQ
How accurate is churn prediction?
In our data of 13,259 customers, customers with the highest Churn Risk Score (5 on a scale of 1 to 5) churned within 60 days at 16%, 31 times more often than customers with the lowest score (1) at 0.5%.
What does a churn risk score of 5 mean?
On Customerscore.io's scale of 1 (lowest risk) to 5 (highest risk), 5 means the customer is in the group most likely to churn. In our data, about 1 in 6 customers at score 5 churned within 60 days. It is a reason to act on that customer first, not a certainty that they will leave.
Is AI churn prediction better than a rule-based health score?
In our data, yes. The AI score separated churn 31 times between its lowest and highest level, the rule-based health score 12 times, with a similar share of customers in the extreme groups. A rule-based score still works, and many teams run both.
What are the early signs of churn inside an account?
Nobody at the company actively using the product, a disengaged champion, and a champion who leaves without a replacement.
Related: How to build a customer health score · Churn prediction in SaaS · SaaS retention statistics from 44,000 users
Related articles
Churn Prediction in SaaS: How to Spot Risk Before You Lose the Customer
Most churning customers show warning signs 30+ days before they cancel. The signals, the prediction methods, and the playbooks that turn a flag into a save.
Blog8 Best Customer Health Score Software Tools (2026)
The 8 best customer health score tools in 2026, compared on how they actually score health: configured vs predicted, churn and expansion, setup time, and admin effort.
BlogSaaS Retention Statistics: 8 Findings From 44,000 Users
1 in 4 paying customers is doing nothing. Monthly plans churn 4.7× faster than annual. Eight findings from analyzing 44,000 SaaS users.
BlogAccount Health Dashboard: A B2B SaaS Guide for 2026
What an account health dashboard is, the metrics it should track, how to implement one your team actually trusts, and how it fits into your B2B SaaS workflows.