
Predict Churn 60–90 Days: Five Phase Customer Risk Scoring for B2B SaaS


Customer risk scoring produces a predictive, explainable health score that flags accounts 60 to 90 days before likely churn, built from usage, engagement, commercial, and qualitative signals. The single first move is to inventory what you can already measure and assign one owner responsible for backtesting and calibration. Everything else, including which model to use, comes after that.
TL;DR:
- Customer risk scores should incorporate signals from usage, engagement, business health, and qualitative signals to accurately predict churn 60 to 90 days in advance.
- Building an effective score involves defining outcomes, inventorying and normalizing key signals, weighting inputs transparently, automating data collection, and validating through backtests.
- Regular recalibration every quarter and continuous monitoring are vital to maintain accuracy, with detection rates above 60 percent and false positives below 50 percent.
- Automating data flow through integrations for usage, CRM, and billing ensures the score updates daily or weekly, enabling timely intervention.
- Implementing clear routing processes for flagged accounts, matching playbooks to specific risk drivers, and measuring response effectiveness are critical to successful retention efforts.
Table of Contents
- What Signals Should a Customer Risk Score Actually Track?
- How Do You Build a Predictive Risk Score From Scratch?
- How Do You Know a Risk Score Is Actually Working?
- How Do You Automate a Risk Score So It Updates Itself?
- What Should Happen the Moment a Risk Score Flags an Account?
- What Actually Breaks Risk Scoring Programs
- How Customerscore.io Puts Risk Scoring Into Practice
- Sources
- FAQ
What Signals Should a Customer Risk Score Actually Track?
Most teams stop at product usage and wonder why the score keeps missing churn until 30 days out. Usage tells you what an account is doing, not why. A risk score built on one dimension is a smoke detector that only checks for smoke and ignores the sound of an argument two rooms over.
Four signal types belong in any serious model, and each behaves differently in terms of speed and honesty.
- Product usage: logins, feature adoption breadth, session duration, and depth of use across core workflows. Fast to capture, but often lagging by the time it moves.
- Engagement patterns: email response rates, QBR attendance, and support ticket sentiment. These move earlier than raw usage because they reflect intent before behavior changes.
- Business and commercial signals: payment health, plan utilization versus contracted seats, and downgrade requests. Slower to shift, but highly reliable once they do.
- Relationship and qualitative signals: sponsor stability, perceived value, and stated renewal intent, captured through structured interviews or CSM notes. These catch voluntary churn that telemetry alone misses because it can't see intent.
Capture usage and engagement weekly. Commercial data can sync on your billing cycle. Qualitative input should get refreshed at least once per quarter, more often for accounts above a certain ARR threshold, since a champion leaving quietly is often the first real signal you get.
How Do You Build a Predictive Risk Score From Scratch?
Building a workable score is not a data science project on day one. It is a five-phase sequence, and skipping ahead to machine learning before phase three is the most common way teams waste six months.
- Define outcomes and horizon. Pick a time window, 60 to 90 days is the standard, and segment by ARR band or ICP so a $10,000 account and a $250,000 account aren't scored on the same curve.
- Inventory signals and standardize. Pull what you can measure today, normalize every input to a 0 to 100 scale, and start with five to eight inputs rather than twenty. Best-in-class B2B SaaS scores rarely use more than eight.
- Weight the inputs. Start with a transparent weighted sum, not a black box. A common starting allocation looks like product engagement around one third, feature adoption about one fifth, support sentiment roughly 15%, executive engagement similar, and smaller weights for NPS and payment health, then adjust once you run regression against historical churn.
- Automate capture. Wire in integrations so usage, CRM, and billing data flow without manual entry, and add AI-driven interviews to convert qualitative answers into structured predictors like sponsor stability and sentiment.
- Validate and iterate. Backtest on a holdout set, measure detection rate, and only add ML ensembles once the weighted-sum model is proven and you need incremental lift.
Pro Tip: Run phases 1 through 3 in a spreadsheet before you touch any tooling. If you can't explain why an account scored 62 using a whiteboard, no platform will fix that for you.
How Do You Know a Risk Score Is Actually Working?
A score that looks smart in a demo and misses half your churn is worse than no score, because it creates false confidence. Validation means backtesting against real history, not eyeballing a dashboard for a few weeks.
Compute what each account's signals looked like 60 and 90 days before it churned, or at the equivalent point for retained accounts, then check whether the model would have flagged it in time. Fewer than 60% of future churners flagged at that horizon means the score isn't actionable yet, and you should keep false positives under roughly 50% or your CSMs will stop trusting the alerts entirely.
| Metric | Target | Why it matters |
|---|---|---|
| Detection rate (60 to 90 days out) | 60 to 90% of eventual churners flagged | Below this, the score misses too many real risks |
| False positive rate | Under 50% | Above this, CSMs ignore the alerts as noise |
| Predictive accuracy at 60 days | high when properly implemented | Marks a properly calibrated model |
| Time-to-first-contact | as soon as possible for Red, within a couple of days for Amber | Speed correlates directly with save rate |
Set your Red band where detection rate stays high without flooding CSMs with false alarms, Amber as the watch zone, and Green as everything healthy enough to leave alone. Recalibrate the thresholds every quarter as your churn base shifts.
How Do You Automate a Risk Score So It Updates Itself?
A score that requires a spreadsheet update every Friday afternoon will die within two months. It needs to run on integrations, not willpower.
Four systems typically feed the pipeline: product analytics (Mixpanel, PostHog, or similar) for usage depth, your CRM (HubSpot or Salesforce) for relationship and deal data, your support tool for ticket volume and sentiment, and billing (Stripe or Chargebee) for payment health and plan utilization.
- Sync usage and engagement data weekly for most mid-market accounts.
- Move to daily updates for product-led or high-velocity motions where behavior shifts fast.
- Automate qualitative capture with AI-driven interviews that convert open-ended answers into structured fields like sponsor stability and stated renewal intent, rather than relying on CSMs to remember to log notes.
- Assign one owner, usually RevOps or a CS analyst, to monitor alert volume and adjust routing rules as false positives creep up.
This is also where scoring becomes more than a report. A score not wired to a playbook functions as a vanity metric no matter how accurate the math is underneath it.
What Should Happen the Moment a Risk Score Flags an Account?
The score is only half the system. The other half is what happens in the next 24 hours, and most teams under-invest here relative to how much time they spend tuning weights.
- Route by band. Amber triggers automated outreach plus a CSM review queue. Red requires a human CSM to make contact within 24 hours, with enterprise accounts escalating straight to a senior CSM or the account executive.
- Match the playbook to the driver. A usage drop calls for an activation fix, walking the account back through onboarding gaps. A sentiment or perceived-value problem calls for a value-resurfacing conversation, often a business review that reconnects the product to the original ROI case. Price pressure calls for a structured discount or term-extension flow, not an improvised discount on a call.
- Track the right triggers. Concrete thresholds work better than gut feel: a 50% login drop against baseline, 21 or more days of champion inactivity, or a threefold spike in support tickets over 14 days.
Pro Tip: Measure playbooks the same way you measure the score itself: time-to-first-contact, response rate, save rate by ARR tier, and the account's health trajectory 60 days after the save. A playbook with a high save rate but a fast relapse rate isn't actually working.
Tactical retention plays, like win-back sequences and renewal framing, pair well with this routing structure. Proven retention tactics can fill out the Amber-tier playbook library once the routing logic is in place.

What Actually Breaks Risk Scoring Programs
The most common failure isn't a bad model. It's building a beautiful dashboard nobody acts on, skipping qualitative signals because they're harder to automate, and treating quarterly recalibration as optional. Before you build anything, confirm you can measure usage and payment health reliably, have 12 to 24 months of labeled churn history, have an owner for recalibration, and can route Red accounts to a human within 24 hours. If any of those four are missing, fix that first. The math is the easy part.
— Patrik
How Customerscore.io Puts Risk Scoring Into Practice
Everything above describes the framework. The platform builds the infrastructure so you're not stitching it together in spreadsheets and Zapier chains for a year before it works.
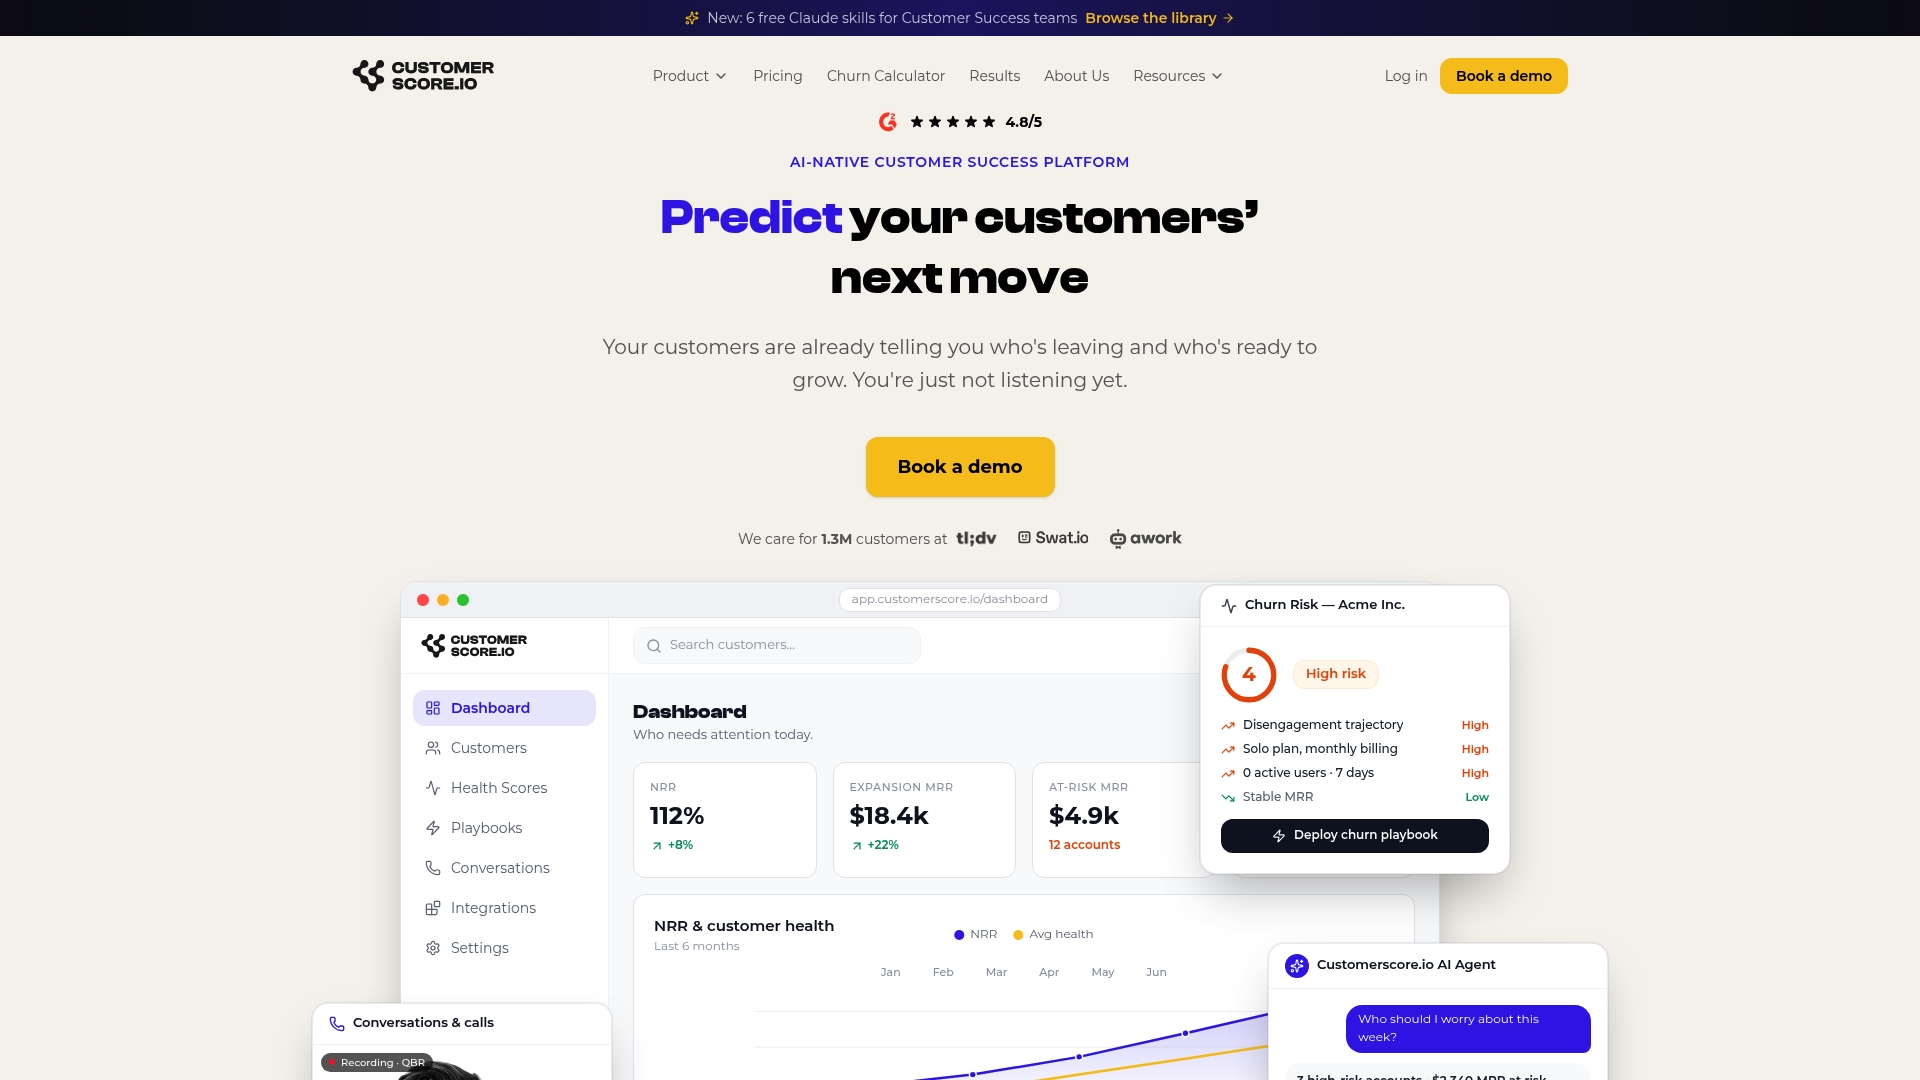
The platform runs AI-driven churn prediction with explainable health scores, pulling multi-source data from billing, product usage, CRM, and support into a single weighted model you can audit. Playbooks route automatically off Amber and Red thresholds, with alerts pushed to messaging tools so CSMs get the 24-hour window this article recommends without building the wiring themselves.
If you're weighing whether to build this in house or buy it, the build versus buy breakdown walks through the tradeoffs honestly. If you already know you want a working score without a six-month build cycle, the AI churn prediction platform is the fastest path, and you can book a demo to see your own account data scored before you commit to anything.
Sources
- Customer Health Score Automation in 2026: A Guide to Signals That Actually Predict Churn | Blog | Perspective AI
- Customer Health Score: Building an Early Warning System for Churn
- Customer Health Score: Build One That Predicts Churn
- Churn Intervention Playbook: CS Workflows to Save At-Risk Accounts | ProductQuant
FAQ
What Is Customer Risk Scoring in B2B SaaS?
It's a predictive, explainable score, usually 0 to 100, that estimates how likely a customer is to churn or need intervention, built from usage, engagement, commercial, and qualitative signals.
How Far in Advance Can a Risk Score Predict Churn?
A properly built score should flag risk 60 to 90 days before likely churn, with qualitative signals detecting risk around 63 days out versus roughly 11 days for manual review alone, according to Perspective AI's analysis.
How Many Inputs Should a Health Score Use?
Five to eight weighted inputs is the standard for best-in-class B2B SaaS scores. More inputs rarely improve accuracy and usually just make the model harder to explain.
How Often Should You Recalibrate a Risk Score?
Quarterly recalibration is the standard cadence, and it can improve predictive accuracy by 8 to 12 percentage points over a year compared to a static model.
Can Customerscore.io Replace a Manual Health Scoring Spreadsheet?
Yes. The platform automates signal capture across billing, product usage, CRM, and support tools, then wires the resulting score directly into routed playbooks instead of a static report.
Recommended
Related articles
90–120 Day Renewal System for CSMs: SaaS Renewal Playbook
90–120 Day Renewal System for CSMs: SaaS Renewal Playbook ! Team planning a structured SaaS renewal Run renewals as a 90 to 120 day managed pipeline, not a calendar reminder.
BlogCut Response Time 60% with This Slack for Customer Success Playbook
Cut Response Time 60% with This Slack for Customer Success Playbook ! Customer success team routing a Slack conversation Slack works best for customer success when it functions as the conversation
BlogProduct Led Customer Success in 90 to 180 Days Without a Data Team
Product Led Customer Success in 90 to 180 Days Without a Data Team ! Customer success operator reviewing product signals Product-led customer success uses product usage data and in-product
Blog30/90/180-Day Health Score Model for SaaS CS: AUC & Playbooks
30/90/180-Day Health Score Model for SaaS CS: AUC & Playbooks ! Analyst calibrating SaaS health score dashboard A health score model is a validated, segment-aware index (usually 0 to 100) that