
30/90/180-Day Health Score Model for SaaS CS: AUC & Playbooks


A health score model is a validated, segment-aware index (usually 0 to 100) that predicts renewal, expansion, or churn risk for each account. The right approach isn't the most complex one. Start with a handful of trusted signals, weight them against real renewal outcomes, validate the result with AUC and calibration checks, then wire it into playbooks your CS team actually follows. Done well, it turns a spreadsheet full of guesses into a prioritized list of accounts worth calling today.
TL;DR:
- Using five core signals—product usage, recency, support tickets, relationship quality, and billing—provides a solid foundation for initial health score models.
- Applying segmentation by account size, tenure, and product line improves model accuracy and fairness, preventing bias against small or new accounts.
- Regular validation through AUC, calibration, and causal plausibility checks ensures the model’s reliability before full deployment.
- Integrating the score into your existing CRM, product analytics, and support systems enables timely, actionable insights for Customer Success teams.
- Starting with a simple weighted index and progressing to more complex machine learning models allows for building trust and improving predictions over time.
Table of Contents
- Health Score Model Checklist: What To Build First
- What Is a Health Score Model and What Should It Predict?
- What Data Signals Actually Belong in a Health Score?
- How Should You Weight and Segment the Model?
- What Tech Stack Do You Need To Run This In Production?
- How Do You Know If Your Health Score Model Is Actually Working?
- From Score to Action: Playbooks, Pilots, and Trust
- Common Pitfalls That Sink Health Score Projects
- Starter Formulas and a 30/90/180-Day Rollout Plan
- Getting Your Data Ready: Cleaning and Feature Engineering
- Bringing Qualitative Feedback Into a Quantitative Score
- Beyond Weighted Averages: When Machine Learning Earns Its Place
- Getting Buy-In Across CS, Sales, and Leadership
- Avoiding Bias and Unfair Outcomes in Health Scoring
- What Actually Moves the Needle in Real Deployments
- Build and Validate Your Health Score Faster With Customerscore
- Sources
Health Score Model Checklist: What To Build First
You don't need a data science team to launch a usable version this quarter. You need five signals, three or four bands, and a habit of acting on the number.
Essential inputs for a first pass:
- Product usage breadth and depth (how many features, how many active seats)
- Usage recency (days since last meaningful login or key action)
- Support signal (ticket volume and unresolved sentiment, inverted so more tickets lower the score)
- Relationship signal (NPS or last sentiment survey response)
- Commercial signal (renewal date proximity, expansion or contraction in spend)
Band-to-action mapping to start with:
- 80 to 100 (Healthy): Flag for expansion outreach, case study requests, referral asks.
- 60 to 79 (Neutral): Quarterly check-in, no urgent action, monitor for drift.
- 40 to 59 (At-risk): CSM outreach within five business days, root-cause call.
- Below 40 (Critical): Escalate to leadership, executive sponsor call within 48 hours.
For a pilot, give yourself 30 days to get the score computing consistently, 90 days to compare scored accounts against actual renewals, and treat any measurable drop in at-risk churn as your signal to expand the model.
What Is a Health Score Model and What Should It Predict?
A customer health score is a composite metric, typically expressed on a 0 to 100 scale or in bands like Healthy, Neutral, At-Risk, and Critical, that estimates the likelihood an account renews, expands, or churns. The scale matters less than what feeds it. A score built entirely on lagging indicators tells you what already happened. A score built on leading indicators tells you what's about to happen, which is the entire point.
Leading indicators worth tracking:
- Drops in weekly active usage before a renewal conversation even starts
- A champion leaving the company or changing roles
- Declining feature adoption breadth over consecutive months
- Slower time-to-value for new team members added to the account
Lagging indicators, useful for validation but poor for action:
- Renewal outcome itself
- Realized expansion revenue
- Formal churn notice
Once you have a working score, translate it into dollars. Multiply the ARR of every account below your at-risk threshold and you get a single number, ARR at risk, that finance and the executive team understand instantly. That number is what gets health scoring taken seriously in a board meeting.
What Data Signals Actually Belong in a Health Score?
Most failed health score projects fail here, not in the math. Teams throw in every metric they can query instead of the handful that actually correlates with renewal outcomes.
Product usage signals carry the most weight in almost every serious model. Breadth (number of distinct features touched), depth (how deeply each feature is used), and recency (days since last login or key action) each measure something different. A customer who logs in daily but only touches one feature is a different risk profile than one who logs in weekly but touches your entire platform. Track the direction of usage, not just the snapshot. A sudden 40% drop in weekly active seats is a far stronger signal than a flat 60% usage rate that's been stable for months, because trending and delta matter more than isolated snapshots for predicting what happens next.
Support signals need to be inverted before they go into any formula. More tickets, longer resolution times, and declining sentiment in ticket text should all pull the score down, not up. Sentiment analysis on support transcripts is worth the engineering effort if you have the ticket volume to make it statistically meaningful.
Relationship signals like NPS, CSAT, and executive touchpoint frequency add context that usage data alone misses. A power user with no relationship at the executive level is exposed the moment their champion leaves.
Financial signals, meaning billing history, payment friction, and expansion or contraction trends, close the loop between behavior and revenue.
- Normalize every raw signal to a common scale (0 to 100 or 0 to 1) before weighting
- Invert signals where a higher raw number means worse health
- Apply a tenure modifier, since a 90-day-old account behaves differently than a 3-year account on the same usage curve
Pro Tip: Start with five signals maximum. Adding a sixth or seventh input before you've validated the first five just adds maintenance debt without adding predictive power.
How Should You Weight and Segment the Model?
Three structural choices decide most of what your model becomes: how you combine signals, whether you weight them by intuition or by data, and whether one model serves every customer or several.
Index scoring (a weighted sum of normalized signals) is the fastest to build and the easiest to explain to a CSM who has never seen a regression coefficient in their life. Logistic regression trades some of that simplicity for statistical rigor, giving you coefficients that reflect actual correlation with churn rather than a guess about which signal matters more. Tree-based models (random forest, gradient boosting) generally outperform both on raw predictive accuracy but cost you interpretability unless you layer explainability tools on top.
- Index scoring: fast to build, easy to explain, the weakest predictive power
- Logistic regression: moderate build effort, coefficients map to real correlation, decent interpretability
- Tree-based models: highest predictive power, requires SHAP or similar to explain individual scores
Weighting should never be a guess dressed up as a formula. Run a logistic regression against 12 to 24 months of labeled renewal and churn data, and let the coefficients tell you which signals actually move outcomes. Health risk index research outside SaaS uses structured methods like the Analytic Hierarchy Process to derive weights, and the same discipline applies to multi-dimension index systems built for customer health.
One validation study found that expanding a lean baseline model with additional validated predictors pushed AUC from roughly 0.72 to 0.87, a meaningful jump in the model's ability to separate accounts that renew from accounts that churn.
Segment before you weight. A model trained across your entire customer base treats a 10 seat startup and a 10,000 seat enterprise account as if they behave the same way. They don't. Build separate models, or at minimum separate weight sets, for distinct segments defined by ARR tier, product line, or usage complexity. Tenure windows matter too: an account in its first 90 days should be scored against onboarding milestones, not the steady state usage patterns you'd expect from a three-year customer.
Calibration and smoothing keep the score from swinging wildly week to week on noisy data. A rolling average over two or three weeks, rather than a raw daily recompute, prevents a single bad login day from tanking an otherwise healthy account's score.
What Tech Stack Do You Need To Run This In Production?
The model is only half the project. The other half is getting fresh, accurate data into it and getting the output in front of the right person fast enough to act.
Integrations that matter most:
- CRM (Salesforce, HubSpot) for account metadata, renewal dates, and relationship history
- Product analytics or event warehouse (Mixpanel, PostHog, Segment) for usage signals
- Billing platform (Stripe, Chargebee) for payment and expansion data
- Support platform (Intercom or similar) for ticket volume and sentiment
Where you compute the score depends on how fresh it needs to be. Batch computation inside a data warehouse, refreshed nightly, works fine for most CS motions since renewal risk rarely shifts hour to hour. Streaming computation adds real engineering overhead and is usually only worth it for high-velocity, usage-based products where a same-day alert changes the outcome. In-app microservices sit in between, giving you near-real-time scores without the full streaming infrastructure bill.
Once the score exists, it needs a home. A dedicated account health dashboard gives CSMs a single view instead of forcing them to check five tools. Alerting rules should route critical-band accounts directly into a CSM's task queue or a Slack channel, not bury them in a report nobody opens until the renewal is already lost.
How Do You Know If Your Health Score Model Is Actually Working?
A model that looks good in a slide deck and a model that's reliable in production are two different things, and the gap between them is validation.
Track these metrics before you trust the score:
- AUC (Area Under the Curve), which measures how well the model separates churned from retained accounts
- Precision@k, which tells you how many of your top-k highest-risk accounts actually churned
- Calibration, meaning whether a predicted 70% churn probability actually churns about 70% of the time
Because churn is a rare event relative to renewals in most B2B SaaS books of business, raw accuracy is a misleading metric. Precision@k and AUC, evaluated separately by segment and tenure bucket, give you a truer read.
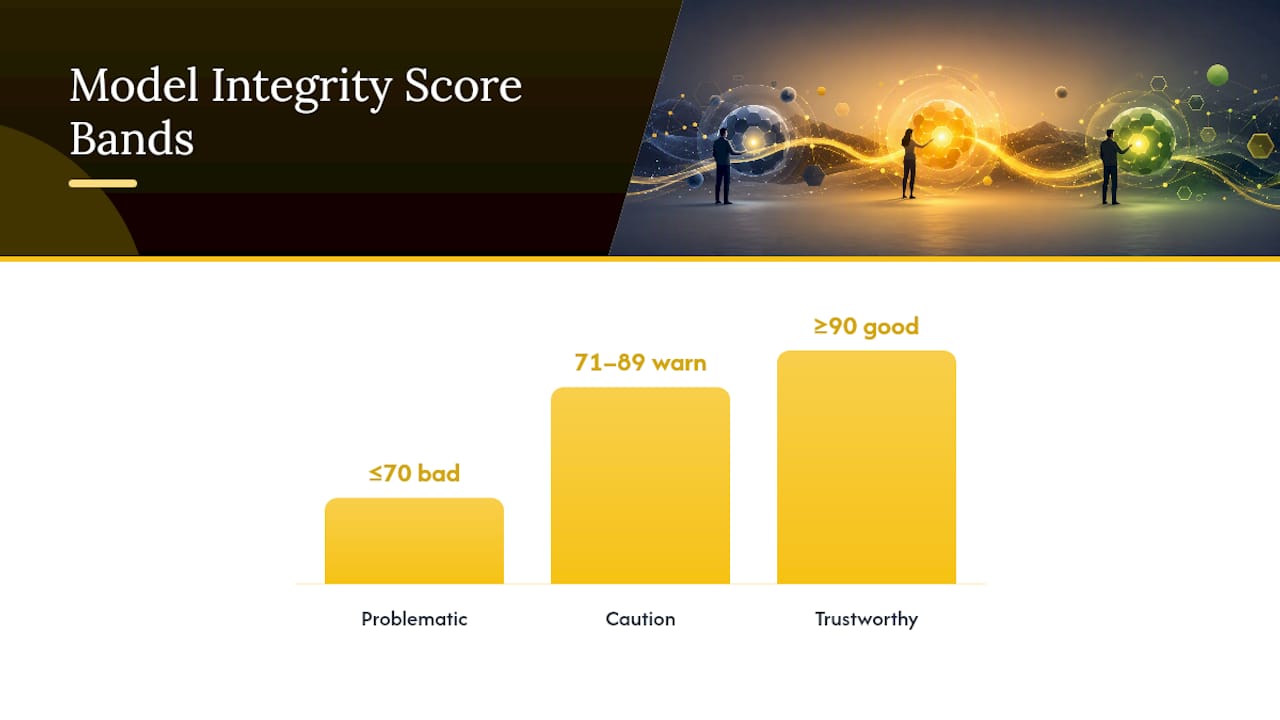
Meridian's model health framework treats calibration and causal plausibility as gatekeepers before predictive power even matters, scoring model integrity checks on their own 0 to 100 diagnostic scale where scores at or above 90 signal a trustworthy model and scores at or below 70 flag systematic problems worth investigating.
Causal plausibility checks catch the errors pure statistics miss. If your model says an account with zero usage decline has a rising churn probability with no explanation, that's not a subtle pattern, that's a broken feature or a data pipeline issue. A model that violates basic business logic should fail integrity checks and get flagged before it ever reaches a CSM's dashboard.
Set a retraining cadence before you launch, not after the model drifts. Retrain quarterly at minimum, and add an automated drift alert that fires when the input distribution or the score distribution shifts meaningfully from your training baseline.
Pro Tip: Split your training data by time, not randomly. Train on months 1 through 18, validate on months 19 through 24. Random splits leak future information into your training set and make your AUC look better than it will be in production.
From Score to Action: Playbooks, Pilots, and Trust
A score nobody acts on is a vanity metric. The path from number to outcome runs through three steps.
- Map every band to a specific playbook. At-risk accounts get a defined outreach script and a five-business-day SLA. Healthy accounts get an expansion nudge. Nobody should have to guess what to do when a score changes.
- Pilot before you roll out company-wide. Pick a segment, run scored accounts against a matched control group left on your old process, and measure the difference in renewal rate or expansion revenue over one full quarter.
- Bring CSMs in early and show them the "why." A dashboard that surfaces the top three feature attributions behind each score change, using SHAP or similar explainability output, turns a black box into a tool people trust enough to act on.
Pro Tip: The single biggest adoption killer is a CSM who gets a "critical" alert with no explanation. Explainability isn't a nice extra layer, it's what makes the difference between a CSM ignoring the alert and a CSM picking up the phone.
Common Pitfalls That Sink Health Score Projects
- Overfitting to historical churn: the model memorizes last year's specific accounts instead of learning generalizable patterns. Fix it with time-based holdouts, not random splits.
- Treating noisy signals as gospel: a single login spike or dip shouldn't swing a score 20 points. Smooth with rolling averages.
- Relying on one metric: usage alone misses relationship and financial risk. Blend at least three signal categories.
- Letting the model go stale: quarterly retraining minimum, sooner if your product or pricing changes materially.
- Misreading silence as satisfaction: a quiet account may be disengaged, not happy. Pair low activity with a check-in, not an assumption.
Escalate to a full investigation when scores contradict known account context (a customer just signed a three-year renewal but scores critical). Retrain, don't investigate, when the whole portfolio's score distribution drifts gradually over a quarter.
Starter Formulas and a 30/90/180-Day Rollout Plan
Two formulas cover most first builds. The weighted index version: (Engagement × 0.30) + (Recency × 0.20) + (Support × 0.15) + (NPS × 0.20) + (Growth × 0.15), multiplied by a tenure factor, with bands set at 80+ Healthy, 60 to 79 Neutral, 40 to 59 At-Risk, below 40 Critical. The logistic regression feature list: usage breadth, usage recency, ticket count (inverted), NPS score, days to renewal, and expansion or contraction flag, trained against a binary renewed/churned label.
- Days 1 to 30: Data engineering owns pipeline setup; CS ops defines bands; ship the weighted index version live to one segment.
- Days 31 to 90: Analytics owns validation, comparing scored accounts against actual renewal outcomes; CS leadership reviews playbook adherence.
- Days 91 to 180: Data science owns migration to logistic regression or tree-based scoring if volume supports it; add SHAP-based explainability to the dashboard.
Add explainability the moment you move past a simple index. A tree-based model without feature importance output is a black box your CS team won't trust.
Getting Your Data Ready: Cleaning and Feature Engineering
Raw event data is messy in ways that quietly wreck health scores before the first weight gets assigned. Duplicate events from retried API calls, bot traffic hitting your app through automated QA scripts, and timezone mismatches between your product database and your CRM all inflate or distort usage signals if nobody catches them first.
Start with deduplication rules at the event ingestion layer, not after the fact. Filter out known service accounts, internal test accounts, and QA environments before they ever touch your usage tables. Missing data deserves a deliberate policy rather than a default. A NULL last-login date could mean the customer never activated, or it could mean your tracking pixel broke for that account. Treat those two cases differently: flag broken tracking as a data quality issue, not a health signal, and route it to engineering rather than the score.
Feature engineering turns raw events into predictive signal. A raw login count tells you less than a rolling 7-day active user trend compared against that account's own 90-day baseline. Ratios often outperform absolutes: percentage of licensed seats active beats raw seat count, because it normalizes for account size automatically.
Preprocessing steps worth automating:
- Deduplicate events at ingestion, not in downstream reporting
- Exclude internal, QA, and demo accounts from the usage pipeline entirely
- Convert absolute counts to ratios or per-seat normalized figures wherever account size varies
- Flag missing data explicitly rather than defaulting it to zero, which silently tanks a score for the wrong reason
Get this layer wrong and every weight and model choice downstream inherits the error.
Bringing Qualitative Feedback Into a Quantitative Score
Usage data tells you what customers do. It rarely tells you why, and the "why" is often where the real risk sits. A customer with strong usage numbers who just told your support team they're "evaluating alternatives" carries more risk than the number alone would suggest.
NPS and CSAT scores are the easiest qualitative signal to quantify since they already arrive as a number. Weight recency here too: an NPS response from 14 months ago tells you far less than one from last week. Open-text survey responses require more work but pay off, particularly when you run basic sentiment scoring against the text and feed a sentiment delta into the model rather than just the numeric score.

Support ticket transcripts are an underused qualitative source. Beyond ticket volume and resolution time, the language customers use in tickets, phrases indicating frustration, repeated escalation requests, or comparison mentions of other vendors, carries real signal. Designing surveys that generate genuinely useful responses matters more than survey frequency; a poorly worded NPS follow-up question generates noise, not insight.
Sales and CSM call notes, when logged consistently in a CRM field rather than scattered across personal notebooks, are a qualitative goldmine most models never touch. A structured "champion status" field, updated after every executive touchpoint, converts a subjective relationship read into a usable model input.
Beyond Weighted Averages: When Machine Learning Earns Its Place
A weighted index is the right starting point for almost every team, but it has a ceiling. It can't capture interaction effects, like the fact that low usage matters far more for an account 30 days from renewal than one 300 days out. Machine learning models can.
Gradient boosting models (XGBoost, LightGBM) and random forests consistently outperform linear approaches on churn prediction tasks because they naturally capture these interactions without you having to hand-engineer every combination. The tradeoff is interpretability, which is exactly why explainability tooling like SHAP has become standard practice alongside these models rather than an afterthought. SHAP-based frameworks let you decompose any individual prediction into the specific features that drove it, which matters enormously when a CSM asks "why is this account suddenly critical?"
Neural network approaches exist for churn prediction but rarely make sense at typical B2B SaaS data volumes. These models need thousands of labeled churn events to train reliably, and most mid-market SaaS companies simply don't churn enough distinct accounts per year to feed one properly. Save the added complexity for a scale where you have the labeled data to justify it.
The practical sequencing that works: launch the weighted index, migrate to logistic regression once you have 12+ months of labeled outcomes, and only move to tree-based models once regression's performance plateaus and you've confirmed the added complexity produces a measurable AUC gain. Skipping straight to the most sophisticated option before validating the simple one is how most health score projects burn a quarter with nothing shipped.
Getting Buy-In Across CS, Sales, and Leadership
A technically excellent health score model that nobody trusts is worthless. Governance and stakeholder alignment aren't bureaucratic overhead, they're what determines whether the model gets used at all.
Start with the CSM team, since they're the ones acting on the score every day. Involve a handful of experienced CSMs in defining the initial signal list and weights before the model ships, not after. A CSM who watched their input shape the formula treats a low score as useful signal. A CSM who was handed a black box treats the same score as an accusation.
Sales and RevOps need a seat at the table too, particularly around how expansion signals feed the model. A score that flags upsell-ready accounts but routes them to CS instead of sales creates friction that has nothing to do with the model's accuracy and everything to do with process design that skipped a stakeholder.
Executive sponsorship should show up as a defined escalation path, not a vague mandate. Critical-band accounts above a certain ARR threshold should trigger an automatic notification to a VP or CS leader, with a documented expectation for response time. Without that structure, critical alerts sit in a queue.
Governance basics worth putting in writing before launch:
- Who owns the model (data science, CS ops, or a shared function) and who approves changes to weights
- A documented retraining and review cadence that isn't left to whoever remembers
- A clear channel for CSMs to flag scores that contradict what they know about an account
Skipping this step is why plenty of technically sound models die quietly six months after launch, unused and unmaintained.
Avoiding Bias and Unfair Outcomes in Health Scoring
A health score model can discriminate against certain customer types even when nobody intended it to. Smaller accounts, newer accounts, and customers in less common use cases often generate less usage data by nature, not by risk. A model trained mostly on large, established accounts can systematically underscore healthy small accounts just because their usage patterns look thinner.
Tenure bias is the most common version of this problem. A 60-day-old account scored against usage patterns typical of a two-year customer will almost always look "at risk," not because it's actually in danger, but because it hasn't had time to reach steady-state usage yet. Segmenting by tenure, as covered earlier, is as much a fairness fix as a predictive one.
Support ticket volume as a negative signal carries its own bias risk. A customer who files more tickets isn't necessarily unhealthy, sometimes they're simply more engaged and more willing to ask for help, which correlates with retention in some product categories. Blindly inverting ticket volume without checking that assumption against your own renewal data can penalize your most engaged customers.
Run periodic audits comparing score distributions across account segments, company size, industry, and region, checking for systematic score gaps that don't correspond to actual churn rate differences. If mid-market accounts in one industry consistently score lower than their actual renewal rate would justify, that's a model correction waiting to happen, not a customer problem.
Transparency helps here too. When CSMs can see the specific features driving a low score, through SHAP output or similar explainability layers, they catch unfair scoring patterns faster than any quarterly audit will. A model nobody can inspect is a model nobody can correct.
What Actually Moves the Needle in Real Deployments
Most health score projects fail because teams build sophisticated models without first validating essential inputs, performing proper calibration checks, and building trust with the CSM team regarding the score's usefulness.
An effective approach leans into that order of operations. Such platforms combine billing, product usage, CRM, and support data into a single explainable score, and surface the specific factors behind every score change rather than handing CS teams an opaque number. In deployments, what typically moves the needle isn't a more exotic algorithm, it's getting the segmentation and tenure handling right early, then giving CSMs a reason to trust the alert before asking them to act on it.
The teams that get the most out of a health score aren't the ones with the biggest data science budget. They're the ones who start small, validate constantly, and treat the score as a living system rather than a launch-and-forget project.
— Patrik
Build and Validate Your Health Score Faster With Customerscore
Building the model in this guide by hand, wiring together your warehouse, CRM, and support tool, takes most teams a full quarter before the first score is trustworthy. Customerscore collapses that timeline by pulling billing, product usage, CRM, and support data into one explainable score automatically, with the causal plausibility and calibration checks covered above already built in.
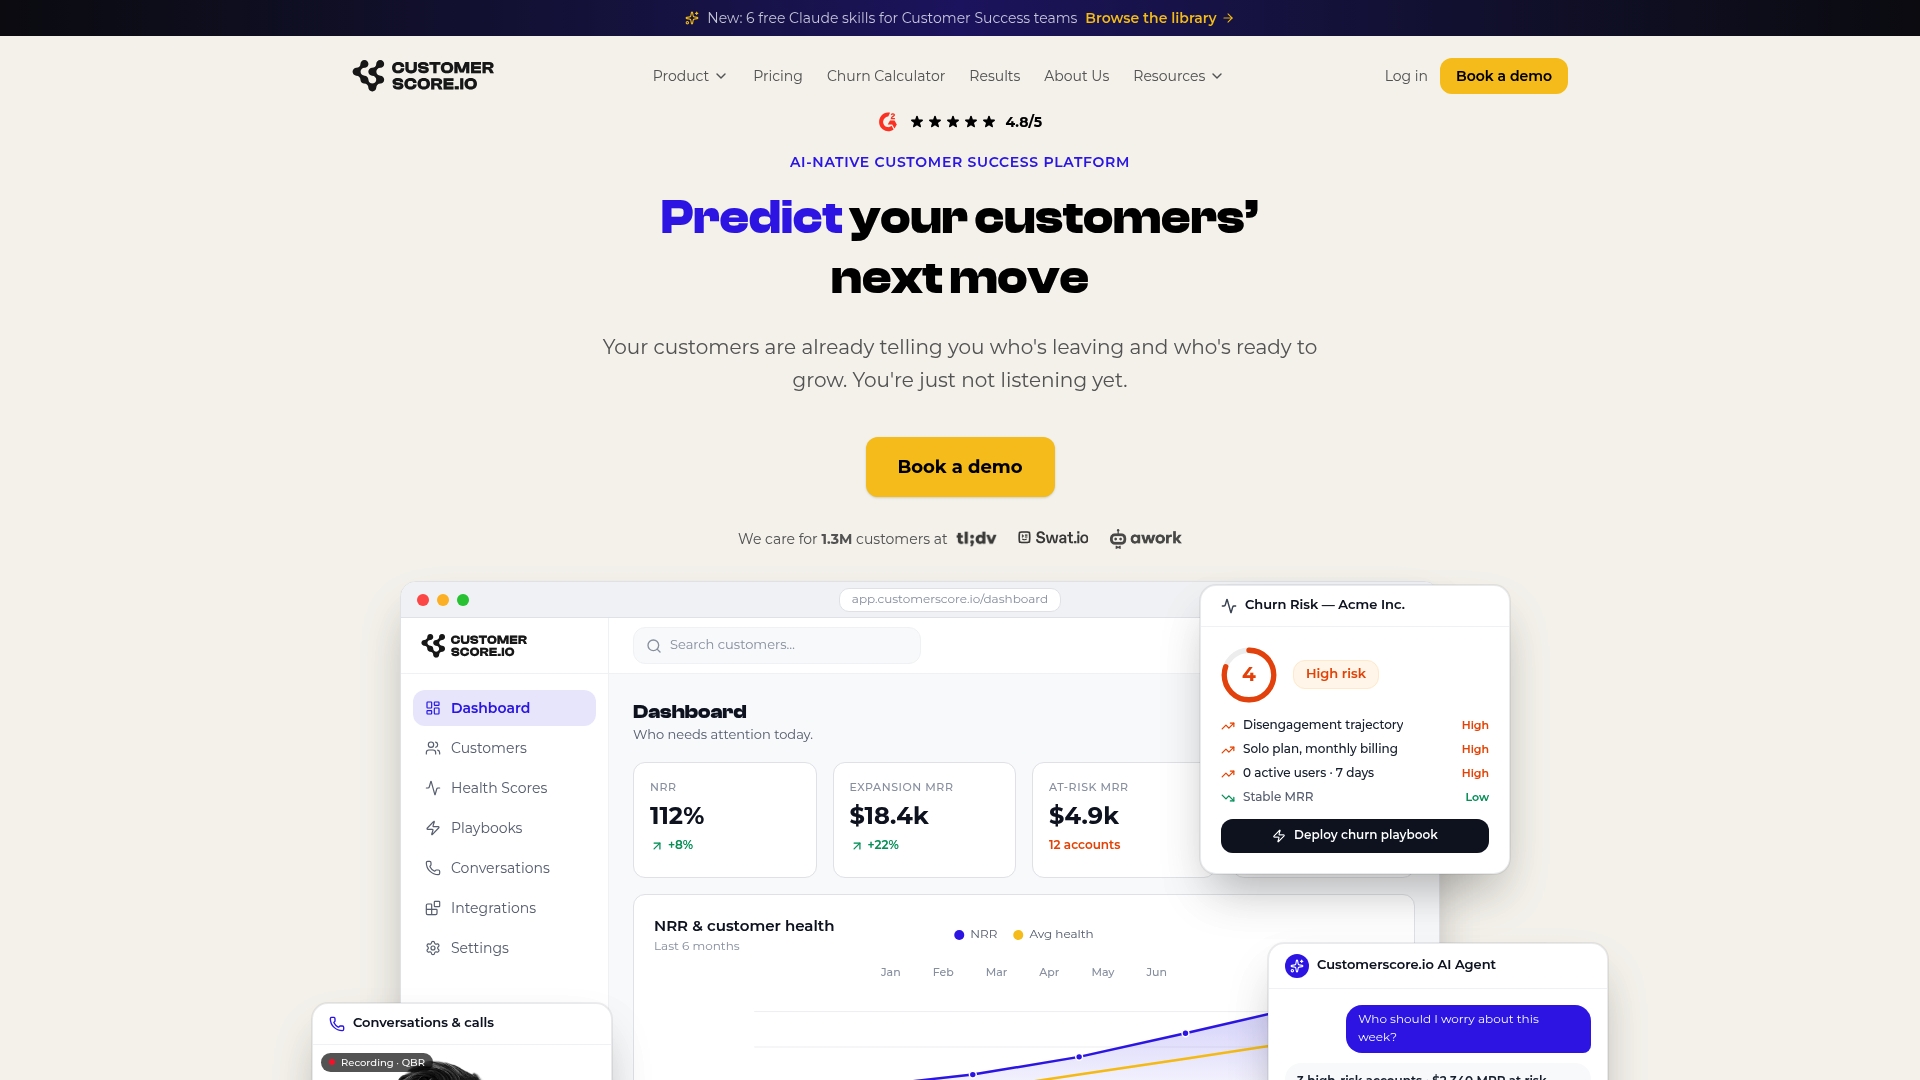
If you're currently piecing together renewal risk from HubSpot fields and gut instinct, Customerscore's HubSpot-native customer success workflows apply score-driven playbooks directly inside the CRM your CS team already lives in. Every score comes with the feature-level explanation behind it, so your CSMs see why an account moved, not just that it did. Book a demo to see how your own renewal and usage data would score on day one.
Sources
- Model health score | Meridian | Google for Developers
- Customer Health Score Calculator | NovaCalculator
- Explainable AI‑Driven Health Scoring Framework for Smart City Sustainability
Recommended
Related articles
90–120 Day Renewal System for CSMs: SaaS Renewal Playbook
90–120 Day Renewal System for CSMs: SaaS Renewal Playbook ! Team planning a structured SaaS renewal Run renewals as a 90 to 120 day managed pipeline, not a calendar reminder.
BlogCut Response Time 60% with This Slack for Customer Success Playbook
Cut Response Time 60% with This Slack for Customer Success Playbook ! Customer success team routing a Slack conversation Slack works best for customer success when it functions as the conversation
BlogProduct Led Customer Success in 90 to 180 Days Without a Data Team
Product Led Customer Success in 90 to 180 Days Without a Data Team ! Customer success operator reviewing product signals Product-led customer success uses product usage data and in-product
BlogPredict Churn 60–90 Days: Five Phase Customer Risk Scoring for B2B SaaS
Predict Churn 60–90 Days: Five Phase Customer Risk Scoring for B2B SaaS ! Customer success manager reviewing account risk dashboard Customer risk scoring produces a predictive, explainable health