
The SaaS Product Feedback Loop: A CS & RevOps Playbook


A product feedback loop is a four-stage revenue system: collect signals, analyze themes, apply fixes, then tell customers what changed. If your team stops after analysis, you have a survey graveyard, not a loop. The immediate action: schedule a weekly 30-minute insights triage with one decision owner from CS or RevOps. That single meeting, run consistently, is what separates programs that reduce churn exposure from programs that generate slide decks.
Table of Contents
- What does a high-impact product feedback loop actually look like?
- Why most feedback programs become a survey graveyard
- How to design feedback that tests hypotheses
- In-app vs. email vs. other channels: which one actually works?
- How to analyze feedback and connect it to churn prediction
- How to prioritize feedback and move it into delivery
- How to close the loop and turn respondents into advocates
- What KPIs prove the loop is working?
- Implementation checklist: six weeks to your first closed loop
- How Customerscore supports each stage of the feedback loop
- Key Takeaways
- The part most teams get wrong
- Customerscore turns your feedback loop into a retention engine
- Sources and further reading
What does a high-impact product feedback loop actually look like?
The four-stage loop is collect, analyze, apply, and close. Most teams run the first two. The last two are where retention lives.
What makes the loop work is cadence. Quarterly campaigns produce stale insight by the time anyone acts. Weekly or sprint-based synthesis keeps signals fresh enough to influence the next sprint's priorities. Think of it as a continuous product improvement cycle rather than a periodic audit.
Signals that feed the loop:
- In-product behavior: feature adoption rates, drop-off points, session depth
- Microsurveys: triggered at key moments (onboarding, upgrade, cancellation)
- Support tickets: tagged by theme and severity
- Churn interviews: structured conversations with churned or at-risk accounts
- Billing events: downgrades, pauses, failed renewals from Stripe or Chargebee
- Health score deltas: sudden drops in Customerscore's scoring model
Why most feedback programs become a survey graveyard
The failure is almost never collection. Teams survey constantly. The breakdown is downstream: no one owns the decision of what to do with the data, tools are siloed, and the lag between collection and action stretches past the point where the insight is still useful.
Feedback is a cost, not an asset, unless it is tied to a specific decision. Asking "what do you think?" without a hypothesis to test produces volume, not signal.
Root causes cluster around four patterns. First, no decision owner: feedback lands in a shared inbox or a Notion doc and waits. Second, siloed tools: survey responses live in one platform, product events in Mixpanel or PostHog, and CRM context in Salesforce, with no join key connecting them. Third, analysis lag: by the time themes are synthesized, the sprint has moved on. Fourth, volume-over-value bias: teams optimize for response count rather than signal quality from the accounts that actually drive revenue.
Most SaaS feedback systems collect data without anyone accountable for turning that data into a decision. Fix the ownership problem first. Everything else is tooling.
How to design feedback that tests hypotheses
Start with decisions, not questions. Map two or three decisions your team needs to make this quarter, then design diagnostics that test the hypothesis behind each one.
Question templates by moment:
- In-app microsurvey (post-feature use): "Did this feature help you accomplish [specific goal]? Yes / Mostly / No — what got in the way?"
- Churn interview (3 questions max): "What was the moment you started looking for alternatives?" / "What would have had to be true for you to stay?" / "Which team felt the pain most?"
- Post-support diagnostic: "Did this resolution unblock your workflow? If not, what's still broken?"
Segmentation matters as much as question design. Trial users need different diagnostics than paid accounts. SMB customers churn for different reasons than enterprise. Churn-risk cohorts, flagged by health score, deserve more targeted outreach than your general NPS blast.
Pro Tip: Avoid volume bias by weighting responses from accounts in the top 30% of ARR or those flagged as churn-risk. A hundred responses from low-value free users can drown out five critical signals from your highest-revenue segment.
In-app vs. email vs. other channels: which one actually works?
In-product surveys capture higher-quality feedback than email because they catch users in context, at the moment of experience. Personalization, showing the collector's name and face, increases response rates further. Email surveys work for longer-form questions and for accounts that are not currently active in the product.

| Channel | Best for | Timing | Signal quality |
|---|---|---|---|
| In-app microsurvey | Feature feedback, onboarding friction | Immediately post-action | High |
| Email survey | Churn risk, NPS, quarterly pulse | — | Medium |
| User interview | Deep diagnosis, strategic decisions | Scheduled, 30 min | Very high |
| Support ticket analysis | Recurring pain themes | Ongoing, tagged weekly | High (unsolicited) |
| Public reviews (G2, Capterra) | Competitive positioning, broad sentiment | Ongoing | Medium |
For unsolicited feedback, support tickets are underrated. They represent real pain, unfiltered. Tag every ticket by theme, product area, and severity. That corpus, reviewed weekly, often surfaces the same issue your surveys miss because no one thought to ask about it.
Privacy note: when linking survey responses to identifiable account data, confirm your data processing agreements cover behavioral data enrichment. This matters especially when combining feedback with billing or CRM records.
Some of the most practical channel guidance comes from looking beyond the obvious survey tools to places customers already express frustration.
How to analyze feedback and connect it to churn prediction
Behavioral analytics is the starting point, not an afterthought. What users do tells you more than what they say. Combine both.
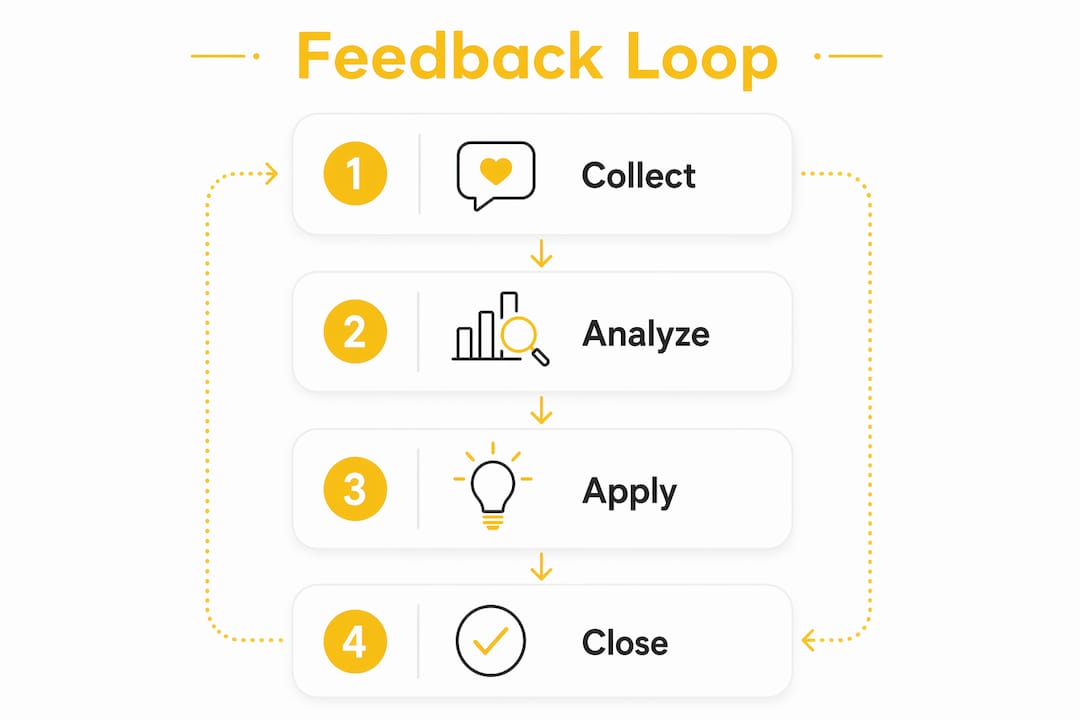
The data flow looks like this: raw feedback from surveys, interviews, and support tickets flows into a central repository (a tagged spreadsheet works at minimum; a purpose-built tool works better). Thematic analysis groups responses by pattern. Those themes are then enriched with product events from Mixpanel or PostHog, billing signals from Stripe or Chargebee, and CRM context from HubSpot or Salesforce. The enriched themes feed directly into your churn model and health score inputs.
Integration notes by tool:
- HubSpot / Salesforce: Push feedback themes as custom properties on the account record. Tag accounts with active pain themes so CS gets context before renewal calls.
- Intercom: Trigger microsurveys from conversation events. Route responses back to the account timeline.
- Mixpanel / PostHog: Join survey responses to behavioral cohorts using the same user ID. This lets you correlate "I can't find X feature" with actual feature non-use.
- Stripe / Chargebee: Flag downgrade and cancellation events as high-priority feedback triggers. These are the moments that demand immediate diagnostic outreach.
When you tag a feedback theme and push it to an engineering ticket, include the account tier, the churn-risk flag, and the revenue at stake. A ticket that says "3 enterprise accounts ($180K ARR, churn-risk) report broken CSV export" moves faster than one that says "users want better exports." For deeper churn pattern analysis, connecting feedback themes to behavioral signals is the core of the method.
How to prioritize feedback and move it into delivery
Prioritize by business exposure, not request count. A feature request from fifty free users ranks below a friction point reported by three enterprise accounts on renewal watch.
Revenue-weighted prioritization steps:
- Tag each theme with: account tier, ARR at risk, churn-risk flag, and expansion potential
- Score using a modified ICE framework: Impact (revenue exposure) × Confidence (signal volume and quality) × Ease (engineering effort)
- Triage weekly: disposition each theme as "ship," "experiment," "research," or "decline with reason"
- Write a one-sentence hypothesis for each "ship" or "experiment" item: "If we fix X, accounts in cohort Y will show Z behavior within N weeks"
Playbook template for triage to delivery:
- Triage: Theme identified, tagged, revenue exposure calculated
- Hypothesis: Decision owner writes the expected outcome and success metric
- Experiment: Smallest shippable test defined; rollback rule documented
- Ship: Feature or fix released to target cohort first
- Measure: Track the success metric for four weeks before declaring impact
SLA recommendations: disposition every new theme within five business days of triage. Tag all related engineering tickets with the feedback source and account IDs so product can trace shipped work back to the original signal.
How to close the loop and turn respondents into advocates
Closing the loop is the most commonly skipped step and the highest-leverage one for converting feedback-givers into advocates.
"We shipped this because you told us it was broken" is one of the most retention-positive messages a CS team can send. It proves the product listens. That proof compounds.
Message templates by outcome:
- We shipped it: "You flagged [specific issue] in [month]. We shipped a fix on [date]. Here's what changed and how to use it."
- We chose not to: "We heard your request for [feature]. After review, we're not building it in this cycle because [reason]. Here's what we're doing instead."
- We're still researching: "Your feedback on [topic] is shaping our roadmap research. We'll update you by [date]."
Channel guidance: personal outreach from the account's CS owner for accounts above your ARR threshold. In-app notices and lifecycle emails for the broader base. For high-value accounts, a brief call beats any email.
Advocacy tactics that compound: public recognition in release notes ("Thanks to feedback from our customers"), co-created case studies with accounts whose pain you solved, and targeted follow-ups that invite the original respondent to test the fix before general release.
What KPIs prove the loop is working?
| Metric | Type | Target signal |
|---|---|---|
| Response rate by segment | Process | Trending up in churn-risk cohort |
| Disposition rate | Process | Most themes dispositioned within SLA |
| Cycle time (collect to ship) | Process | Decreasing sprint over sprint |
| Churn delta (treated vs. control) | Business | Reduction in churned ARR from addressed cohort |
| Expansion rate | Business | Increase in upsell from accounts with closed loops |
| NPS / CSAT delta | Business | Improvement in segments with shipped fixes |
For experiments, use cohort A/B where possible: apply the fix to one segment, hold a matched segment as control, and measure churn delta over eight weeks. For high-value accounts, before/after measurement with a synthetic control works when sample sizes are too small for A/B. Realistic timeline: expect process metric improvement in weeks four through eight, and business metric movement in months three through six. The math on retention makes even a one-point churn reduction worth the investment.
Track retention metrics beyond churn rate to catch expansion signals the loop generates alongside pure retention gains.
Implementation checklist: six weeks to your first closed loop
Phase timeline:
- Week 1: Identify two or three decisions for the quarter; assign one decision owner
- Weeks 2–3: Connect data sources (product analytics, CRM, billing); set up a central feedback repository with tagging schema
- Week 4: Run first thematic analysis on existing data; identify top three themes by revenue exposure
- Week 5: Hold first triage meeting; disposition all three themes; write hypotheses
- Week 6: Send first closed-loop messages to respondents; ship or schedule the highest-priority fix
Role accountability:
- Decision owner (CS or RevOps lead): runs triage, owns disposition, writes hypotheses
- Analyzer: synthesizes themes weekly, maintains the repository
- Integrator: manages data connections between tools
- Comms owner: drafts and sends closed-loop messages
Minimum viable tooling for a lean team: an in-app survey tool (Qualaroo or equivalent), a tagging layer in your CRM (HubSpot or Salesforce), a shared repository (Notion or Airtable), and a product analytics connection (Mixpanel or PostHog). For customer retention tooling that goes beyond surveys, a purpose-built platform accelerates every phase.
How Customerscore supports each stage of the feedback loop
Customerscore maps directly onto all four stages, which is why CS and RevOps teams use it as the operational backbone rather than a bolt-on.
Feature-to-stage mapping:
- Collect: Multi-source data ingestion from billing (Stripe, Chargebee), product usage (Mixpanel, PostHog, Segment), CRM (HubSpot, Salesforce), and support (Intercom) centralizes signals automatically
- Analyze: Explainable health scoring surfaces which accounts are at risk and why, combining behavioral, billing, and engagement signals into a single score with visible drivers
- Apply: Automated playbooks trigger actions when health scores drop or churn signals appear, routing the right intervention to the right team member with SLA tracking built in
- Close the loop: Real-time alerts and Slack notifications keep CS owners informed when an account's situation changes, so follow-up is timely rather than reactive
Integration matrix:
| Tool | Integration type | What it enables |
|---|---|---|
| HubSpot / Salesforce | Bidirectional CRM sync | Account context in every health score |
| Intercom | Support event ingestion | Support themes feed churn model |
| Mixpanel / PostHog | Product event stream | Behavioral signals in health scoring |
| Stripe / Chargebee | Billing event triggers | Downgrade and cancellation alerts |
| Slack | Real-time notifications | Instant CS alerts on score drops |
The GoodAccess case study on the Customerscore site illustrates how a B2B SaaS team used AI-driven health scoring to operationalize their CS workflows and reduce manual triage time significantly.
Key Takeaways
A product feedback loop only reduces churn when all four stages run continuously, one person owns the decisions, and customers hear back about what changed.
| Point | Details |
|---|---|
| Assign one decision owner | Without a named owner, feedback themes stall at analysis and never reach delivery. |
| Run weekly triage | A 30-minute weekly meeting to disposition themes is the minimum cadence that keeps insights actionable. |
| Weight by revenue exposure | Prioritize themes by ARR at risk and churn-risk flag, not by response volume. |
| Close the loop explicitly | Sending "we shipped this because you told us" messages converts respondents into advocates and reduces churn. |
| Customerscore as backbone | Customerscore connects billing, product, CRM, and support data into one health score and automates the playbooks that act on it. |
The part most teams get wrong
The conventional advice is to collect more feedback. Build more surveys, add more channels, increase response rates. That instinct is wrong. The bottleneck is almost never collection. It is the gap between a theme being identified and a human being accountable for deciding what to do about it.
Teams that run effective loops are not running more surveys. They are running fewer, better-targeted ones, and they have someone in the room every week whose job is to say "we're shipping this," "we're not," or "we need more signal." That meeting, with that decision authority, is the entire difference.
The other thing practitioners underestimate: closing the loop is not a courtesy. It is a retention mechanism. Customers who hear back about their feedback churn at lower rates than those who do not. The message does not need to be long. It needs to be specific and honest, including when the answer is no.
Start with one decision. Instrument one prompt. Run one triage. Send one closed-loop message. The process compounds from there.
Customerscore turns your feedback loop into a retention engine
If your team has the signals but not the system to act on them, Customerscore closes that gap. It pulls billing data from Stripe and Chargebee, product events from Mixpanel and PostHog, and CRM context from HubSpot and Salesforce into a single explainable health score, then fires the right playbook automatically when a score drops.
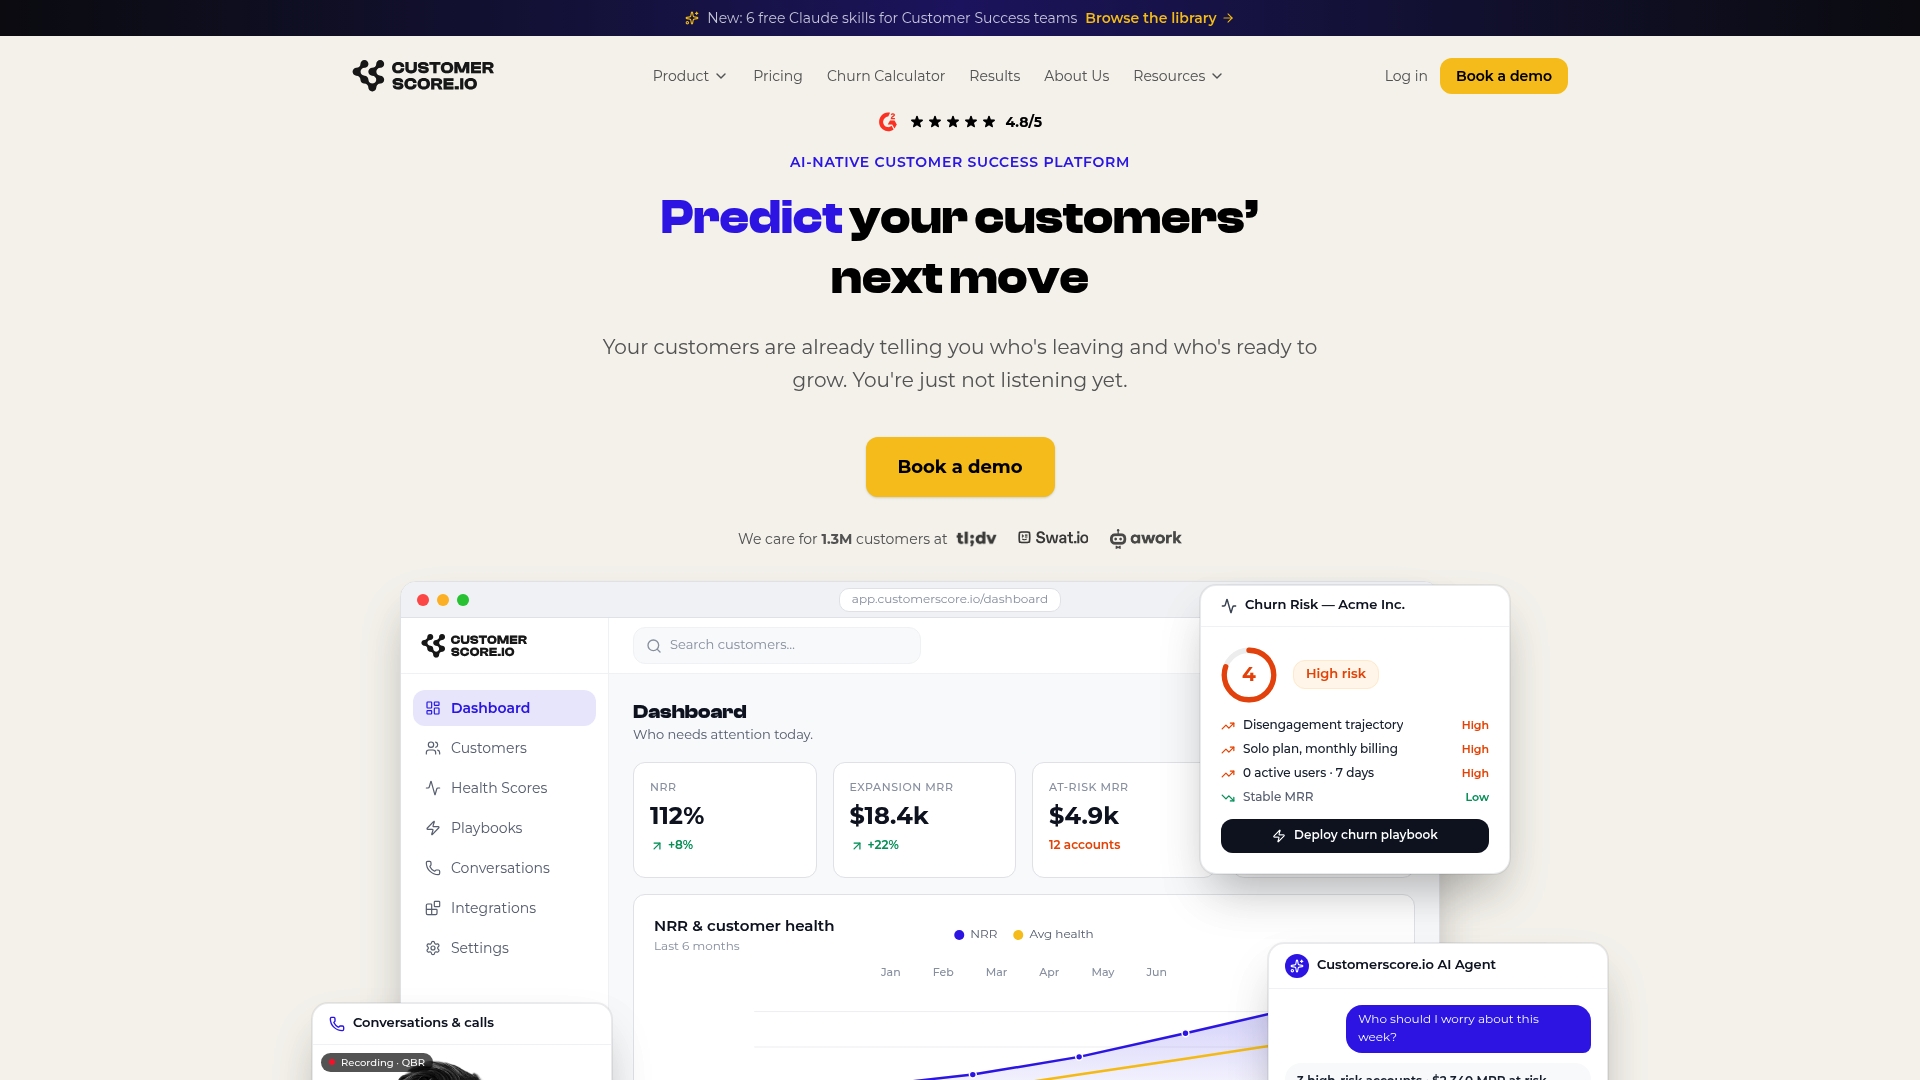
The result: your CS team spends less time hunting for context and more time on the conversations that prevent churn. Automated alerts surface at-risk accounts before the renewal conversation gets awkward. Playbooks with built-in SLAs keep every intervention on schedule.
- Explainable churn prediction that shows you why an account is at risk, not just that it is
- Health scoring that combines behavioral, billing, and support signals in one view
- Automated playbooks for onboarding, renewal, and expansion workflows
- Native integrations with HubSpot, Salesforce, Intercom, Mixpanel, Stripe, and Slack
Book a demo and see how Customerscore maps to your current feedback and retention workflow.
Sources and further reading
These sources informed the playbook above. Each one is worth bookmarking for your own feedback repository and triage documentation.
- Customer Feedback Loop Guide 2026 — Koji: Practical breakdown of the four-stage loop and the six-week build plan; useful as a team onboarding read.
- Product Development Lifecycle — Amplitude: Frames continuous iteration as the default mode for post-launch SaaS; good for aligning product and CS on cadence.
- SaaS Feedback Loops — GrowthLayer: Covers decision ownership and behavioral analytics as the foundation; the most operationally focused of the three.
- Product Feedback Loop Playbook — SigOS: Prioritization heuristics and centralization guidance for teams moving from ad hoc to structured loops.
- Closing the Customer Feedback Loop — Gleap: The best single resource on communication templates and the advocacy mechanics of closing the loop.
- Product Improvement Process — KoalaFeedback: Step-by-step measurement discipline for teams that want to prove impact after shipping.
- In-App Survey Tools — GetUserFeedback: Context on why in-product collection outperforms email for signal quality.
- 5 Places to Find Customer Feedback — Talkroute: A practical channel roundup that goes beyond the standard survey-first approach.
Recommended
Related articles
Best GuideCX Alternatives for B2B SaaS CS Teams
Best GuideCX Alternatives for B2B SaaS CS Teams ! Customer success team collaborating on onboarding plans Customerscore is the recommended pick for most B2B SaaS customer success teams looking for
BlogAI Customer Success: A Practical Pilot Playbook for 2026
AI Customer Success: A Practical Pilot Playbook for 2026 ! Customer success manager reviewing AI pilot dashboard Start with account health scoring and QBR auto-prep.
BlogCustomer Escalation Management: 2026 B2B SaaS Guide
Customer Escalation Management: 2026 B2B SaaS Guide ! Customer success manager reviewing escalation flowcharts Customer escalation management is the structured process of routing customer issues
BlogAccount Health Dashboard: A B2B SaaS Guide for 2026
What an account health dashboard is, the metrics it should track, how to implement one your team actually trusts, and how it fits into your B2B SaaS workflows.