
NPS vs CES for B2B SaaS: Which Metric Wins?


Track both NPS and CES, but give each a distinct owner and a distinct job. NPS is your relationship headline: it tells leadership whether customers would recommend you and feeds board-level retention narratives. CES is your operational friction detector: it flags where customers are struggling in real time, often before they've decided to leave. If you can only instrument one right now, pick the metric that matches your most urgent problem.
- Reduce churn or fix onboarding friction → start with CES
- Report on relationship health to leadership or investors → start with NPS
- Running a mature CS program → run both, mapped to separate owners and cadences
Pro Tip: Never ask both questions in the same survey. Mixing a relational NPS question with a transactional CES question in one send contaminates both signals and confuses the respondent about what they're actually rating.
Table of Contents
- What is NPS and CES? Definitions, scales, and how each is scored
- How NPS and CES compare: purpose, timing, owners, and predictive power
- Where to use NPS and CES across the B2B SaaS customer lifecycle
- What are the pros and cons of NPS and CES for B2B SaaS?
- How to implement NPS and CES in production
- What to do when scores are low: playbooks and SLAs
- Common mistakes and best practices when using NPS and CES
- Does CES actually predict churn better than NPS?
- Key Takeaways
- The metric that actually moves the needle
- Customerscore turns your NPS and CES scores into retention actions
- Useful sources and further reading
What is NPS and CES? Definitions, scales, and how each is scored
Net Promoter Score (NPS) asks one question: "On a scale of 0–10, how likely are you to recommend [Company] to a colleague or friend?" Respondents fall into three groups based on their recommendation likelihood score: high promoters, passive neutrals, and detractors. The NPS formula is simple: subtract the percentage of Detractors from the percentage of Promoters. A score well above neutral is generally considered strong in B2B SaaS; low scores warrant investigation.
Customer Effort Score (CES) asks how easy it was to complete a specific task. The most common phrasing, popularized after Gartner research showed that reducing effort builds loyalty more reliably than delighting customers, is: "The company made it easy for me to handle my issue." Respondents rate agreement on a 1–7 scale (sometimes 1–5), where higher scores mean lower effort. CES is typically reported as an average or as the percentage of respondents who rated effort high (5–7 on a 7-point scale).
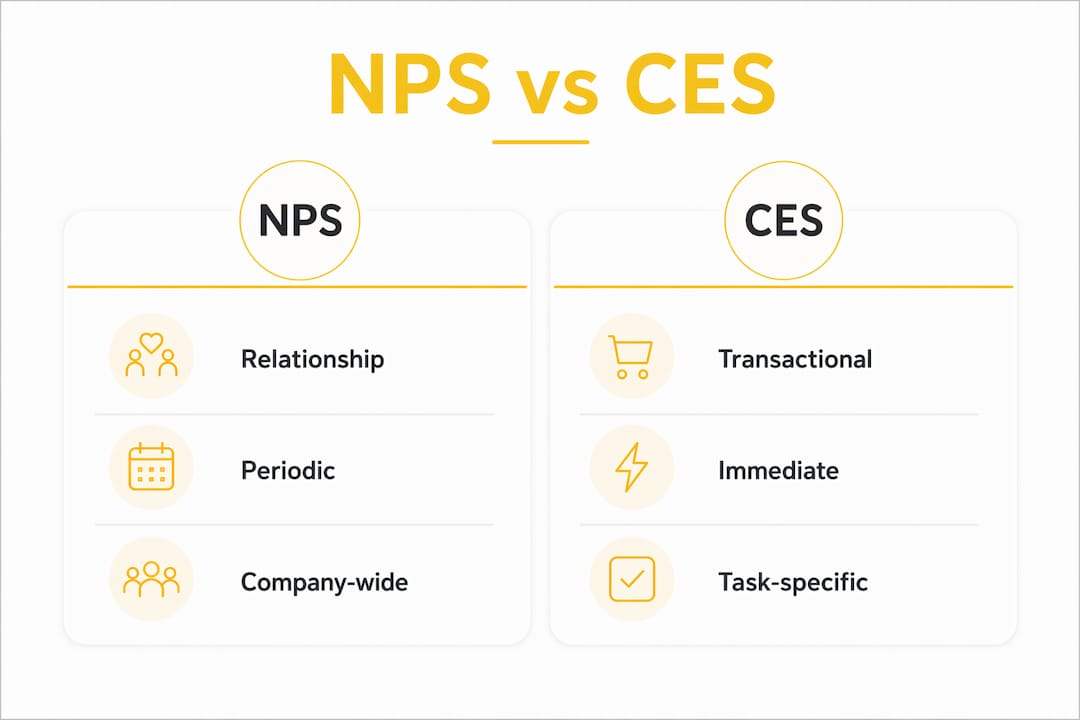
Unlike NPS, CES is relational vs transactional in the opposite direction: it's scoped to a single interaction, not the overall relationship.
Sample survey questions for B2B SaaS contexts
| Metric | Moment | Example question | Scale |
|---|---|---|---|
| NPS | Quarterly relationship check | "How likely are you to recommend [Product] to a peer in your industry?" | 0–10 |
| NPS | 60 days post-renewal | "How likely are you to recommend [Product] to another SaaS team?" | 0–10 |
| CES | Post-onboarding milestone | "The onboarding process made it easy for my team to get started." | 1–7 (agree/disagree) |
| CES | Post-support ticket close | "How easy was it to resolve your issue with our support team?" | 1–7 |
| CES | Post-implementation review | "How much effort did your team have to put in to complete the initial setup?" | 1–7 |
Always append an open-text follow-up: "What's the main reason for your score?" That single field is where the diagnostic value lives, especially for CES.
How NPS and CES compare: purpose, timing, owners, and predictive power
The core difference is relational versus transactional. NPS measures how a customer feels about your company over time. CES measures how hard it was to do one specific thing. That distinction determines everything else: when you send the survey, who acts on the result, and what kind of churn signal each metric provides.

| Dimension | NPS | CES |
|---|---|---|
| Purpose | Relationship health and advocacy | Friction detection at a specific interaction |
| What it measures | Likelihood to recommend (overall loyalty) | Ease of completing a task or resolving an issue |
| Question wording | "How likely are you to recommend us?" (0–10) | "The company made it easy to…" (1–7 agree/disagree) |
| Typical cadence | Periodic: quarterly or semi-annually | Event-triggered: immediately after interaction |
| Action owner | CS leadership, account management, marketing | Product, support ops, onboarding team |
| Predictive power | Lagging indicator of relationship decline | Leading indicator of near-term churn risk |
| Typical playbook | Escalation to AM, win-back offer, executive QBR | Ticket follow-up, onboarding fix, friction removal |
When NPS is the higher-signal option:
- Ahead of renewal conversations, to gauge advocacy and flag at-risk accounts
- For board or investor reporting on customer sentiment trends
- When you want to segment customers into promoter/detractor cohorts for expansion targeting
When CES is the higher-signal option:
- Immediately after a support ticket closes, to catch unresolved friction before it compounds
- At onboarding milestones, where high effort on key workflows correlates directly with early churn
- After a product update or new feature rollout that changes a core workflow
Where to use NPS and CES across the B2B SaaS customer lifecycle
The lifecycle placement of each metric is where most teams get it wrong. They send NPS after every interaction and wonder why scores are noisy, or they skip CES entirely and only find out about onboarding friction when a customer churns at month three.
Onboarding completion → CES. The moment a customer completes their first major onboarding milestone, send a CES survey. The owner is the onboarding team or implementation manager. If the score is low, the immediate action is a same-day check-in call, not a ticket. CES is particularly effective at identifying friction in onboarding workflows, where effort reduction directly improves retention.

Post-implementation review → CES. At the 30- or 60-day mark after go-live, a CES survey scoped to the implementation process surfaces configuration gaps and workflow friction the customer may not have escalated. The product team owns the aggregate signal; the CS manager owns the individual account response.
Quarterly relationship review → NPS. Send NPS on a fixed quarterly or semi-annual cadence, decoupled from any specific interaction. The account manager and CS leadership own the result. A Detractor response at this point should trigger an escalation workflow, not just a follow-up email.
Renewal → NPS. Sixty to ninety days before renewal, an NPS pulse gives the account executive a concrete signal to bring into the renewal conversation. A Promoter score opens the door to expansion; a Detractor score triggers a structured win-back process.
Multi-seat and enterprise accounts: sample at the account level, not just the seat level. Surveying every user at a 500-seat enterprise creates noise and fatigue. Weight responses by role: economic buyers (VP, C-suite) carry more signal for NPS; power users and admins carry more signal for CES. Tag responses with account tier and product area so downstream playbooks can route correctly.
What are the pros and cons of NPS and CES for B2B SaaS?
NPS advantages and limits
NPS is trendable over time, which makes it useful for board reporting and investor narratives. The 0–10 scale is universally understood, so you can benchmark against industry data without explaining the methodology. It's also a reasonable proxy for expansion revenue potential: Promoters are far more likely to expand or refer than Detractors.
The limits are real. NPS is a lagging indicator that often declines only after a customer has already mentally decided to churn. It also tells you nothing about why the score is what it is without a follow-up open-text question. Many teams track NPS out of habit rather than because it drives a specific operational decision, which is exactly the misuse pattern that erodes its value.
CES advantages and limits
CES is operationally specific. A high-effort score after onboarding tells the implementation team exactly where to intervene, within a window where intervention still prevents churn. Practitioners frequently report CES as a stronger short-term churn predictor than NPS because it surfaces friction before the customer has formed a negative overall impression.
The trade-off: CES is narrow by design. It can't tell you whether a customer loves your product or is likely to expand. It also requires disciplined event-triggering; a CES survey sent three days after a ticket closes is far less useful than one sent within an hour.
Pro Tip: For both metrics, the open-text "why" question is where the real signal lives. For NPS, ask "What's the primary reason for your score?" For CES, ask "What made this harder than it should have been?" Keep the follow-up optional but prominent. Response rates on optional open-text fields average 10–30% but the qualitative themes they surface are often more actionable than the numeric score itself.
Survey fatigue is a real risk when both metrics are deployed without discipline. The fix is simple: decouple them entirely. NPS runs on a periodic schedule; CES runs on event triggers. They should never share a survey send.
How to implement NPS and CES in production
Getting the question text right is only half the job. The other half is the trigger logic, cadence rules, and integration plumbing that turns raw responses into routed actions.
NPS implementation checklist:
- Send on a fixed periodic cadence: quarterly for high-touch accounts, semi-annually for low-touch or self-serve
- Target the economic buyer or primary champion, not every seat
- Suppress NPS sends for accounts that received one in the past 90 days
- Append one open-text follow-up: "What's the primary reason for your score?"
- Route Detractor responses (0–6) to the account manager within 24 hours via CRM alert
- Tag responses with account tier, ARR band, and renewal date for segmentation
CES implementation checklist:
- Trigger immediately after: support ticket close, onboarding milestone completion, feature activation, or implementation sign-off
- Use a 1–7 agreement scale: "The [Company] team made it easy to [specific action]"
- Send within 60 minutes of the triggering event for highest response rates
- Suppress if the same customer received a CES survey in the past 14 days
- Append: "What made this harder than it should have been?" (optional open-text)
- Route low-effort scores (1–3 on a 7-point scale) to the relevant team owner within 4 hours
Integration and tagging: Pipe both survey responses into your CRM or CS platform with event tags that identify the trigger (e.g., ces_onboarding_milestone_1, nps_q2_relationship). This tagging structure lets you build playbook conditions like "if CES score ≤ 3 AND trigger = onboarding → assign onboarding technician + 48-hour SLA." Without consistent tagging, scores sit in a dashboard and nothing happens.
Automating CS outreach with playbooks is where the measurement investment actually pays off. The survey is just the trigger; the playbook is the value.
What to do when scores are low: playbooks and SLAs
A score without a downstream action is just a number. Here are three compact playbooks CS and product teams can adapt immediately.
Playbook 1: High-effort onboarding (CES ≤ 3 at milestone 1)
- Trigger: CES response ≤ 3 within 60 minutes of onboarding milestone completion
- Owner: Onboarding manager
- Action: Same-day outreach call; assign dedicated onboarding technician if not already assigned
- SLA: First contact within 4 hours; resolution or escalation within 48 hours
- Measure: Did the customer complete milestone 2 within the expected window?
Playbook 2: Post-support high effort (CES ≤ 3 after ticket close)
- Trigger: CES response ≤ 3 within 2 hours of ticket close
- Owner: Support team lead
- Action: Reopen ticket for review; CS manager notified if account ARR exceeds threshold; evaluate credit or service recovery
- SLA: Follow-up within 2 hours; resolution decision within 24 hours
- Measure: Did the customer contact support again for the same issue within 7 days?
Playbook 3: Low NPS at renewal (NPS 0–6, 60–90 days pre-renewal)
- Trigger: NPS Detractor response during renewal window
- Owner: Account manager + CS manager
- Action: Escalation call within 48 hours; executive sponsor looped in for accounts above ARR threshold; structured win-back offer prepared
- SLA: First contact within 24 hours; renewal risk assessment within 5 business days
- Measure: Renewal rate for Detractor-flagged accounts vs. baseline
Link these playbooks to customer success playbooks software so triggers fire automatically rather than depending on a human to notice a low score in a dashboard.
Common mistakes and best practices when using NPS and CES
The most expensive mistake is using NPS to diagnose transactional problems. If your support queue is generating complaints, an NPS survey won't tell you which ticket type is causing the friction. That's a CES job. Using the wrong metric for the wrong question produces data that looks actionable but isn't.
A close second: mixing relational and transactional questions in one survey. Asking "How likely are you to recommend us?" and "How easy was our onboarding?" in the same send forces the respondent to context-switch between two completely different frames of reference. The scores you get are a blend of both, which means neither is reliable.
Other frequent errors:
- Surveying every seat at an enterprise account, which generates noise and fatigue without improving signal quality
- Ignoring sample bias: if only power users respond to CES, you're missing the friction experienced by occasional users who are actually higher churn risk
- Treating NPS as an operational metric and escalating every Detractor response to the product team, when most Detractor scores reflect relationship issues that belong with account management
- Failing to close the loop: customers who receive a survey and never hear back are measurably less likely to respond to the next one
Best-practice checklist:
- Separate NPS and CES into distinct programs with distinct cadences and owners
- Map every score range to a named action owner and a defined SLA
- Validate survey signals against behavioral data: if CES is improving but churn is rising, the survey is not capturing the real friction source
- Set a closed-loop standard: every Detractor NPS and every low CES score gets a human response within 24 hours
Pro Tip: Tie each metric explicitly to a downstream action before you launch the survey. If you can't name what will happen when a score comes in low, the survey isn't ready to send. Metrics without linked actions are measurement without improvement.
Does CES actually predict churn better than NPS?
The short answer is: for near-term, operational churn risk, yes. NPS is a lagging indicator. By the time NPS declines, a customer has often already formed the intention to leave. CES catches friction earlier, at the specific moments where unresolved effort converts into churn decisions.
Gartner's research showed that reducing customer effort builds loyalty more reliably than exceeding expectations. The mechanism is straightforward: high effort at a critical touchpoint (onboarding, support, implementation) creates unresolved frustration. That frustration doesn't always surface in a quarterly NPS survey, but it does show up in CES responses taken immediately after the interaction.
The HBR piece "Stop Trying to Delight Your Customers" made the same point from a different angle: customers who experience low-effort interactions are far more likely to repurchase and increase spend than customers who were "delighted" by above-and-beyond service. Reducing friction is a more reliable retention lever than adding delight.
For CS teams building monitoring dashboards, this means CES on onboarding and support should sit alongside churn prediction signals as a leading indicator, not as a standalone satisfaction metric. When CES drops below threshold on a high-ARR account, it should trigger the same urgency as a health score alert. Customer feedback programs that connect effort signals to revenue outcomes consistently show stronger retention results than those tracking satisfaction alone.
Key Takeaways
NPS and CES are most powerful when each is mapped to a specific decision owner, a defined cadence, and a concrete downstream action — not tracked in parallel without clear accountability.
| Point | Details |
|---|---|
| Use both, but separately | NPS tracks relationship health on a periodic cadence; CES tracks interaction friction on event triggers. |
| CES is the earlier churn signal | High effort at onboarding or support milestones predicts near-term churn before NPS declines. |
| Map every score to an owner | NPS belongs to CS leadership and account management; CES belongs to product, support, and onboarding teams. |
| Playbooks make scores useful | A low score without a linked SLA and action owner is data, not a program. Build the playbook before you launch the survey. |
| Customerscore operationalizes both | Customerscore connects NPS and CES signals to automated playbooks, health scoring, and churn prediction in one platform. |
The metric that actually moves the needle
Most CS teams I've seen spend more time debating which metric to track than building the workflows that act on the scores. That's the wrong argument. NPS and CES answer different questions for different audiences, and the teams that get the most value from both are the ones who've stopped treating them as competing KPIs and started treating them as inputs to distinct operational systems.
Leadership wants NPS because it's a single number they can trend over time and present to a board. That's legitimate. But the CS manager who gets a Detractor alert on a $200K ARR account 60 days before renewal doesn't need a trend line. They need a playbook that fires automatically and a clear SLA for the first call.
CES is underused in B2B SaaS, mostly because it requires more disciplined instrumentation than NPS. You have to define the trigger events, set the timing rules, and build the routing logic. That's more work upfront. But it's also the metric that tells you something is wrong while you can still fix it, not after the customer has already decided to leave.
The teams that run both well share one trait: they've mapped every score range to a named person and a named action. Not a team. Not a process. A person and an action. That's the difference between a measurement program and a retention program.
Customerscore turns your NPS and CES scores into retention actions
Tracking NPS and CES is only half the job. The other half is what happens when a score comes in low at 11 PM on a Thursday, on a $300K ARR account, 45 days before renewal.
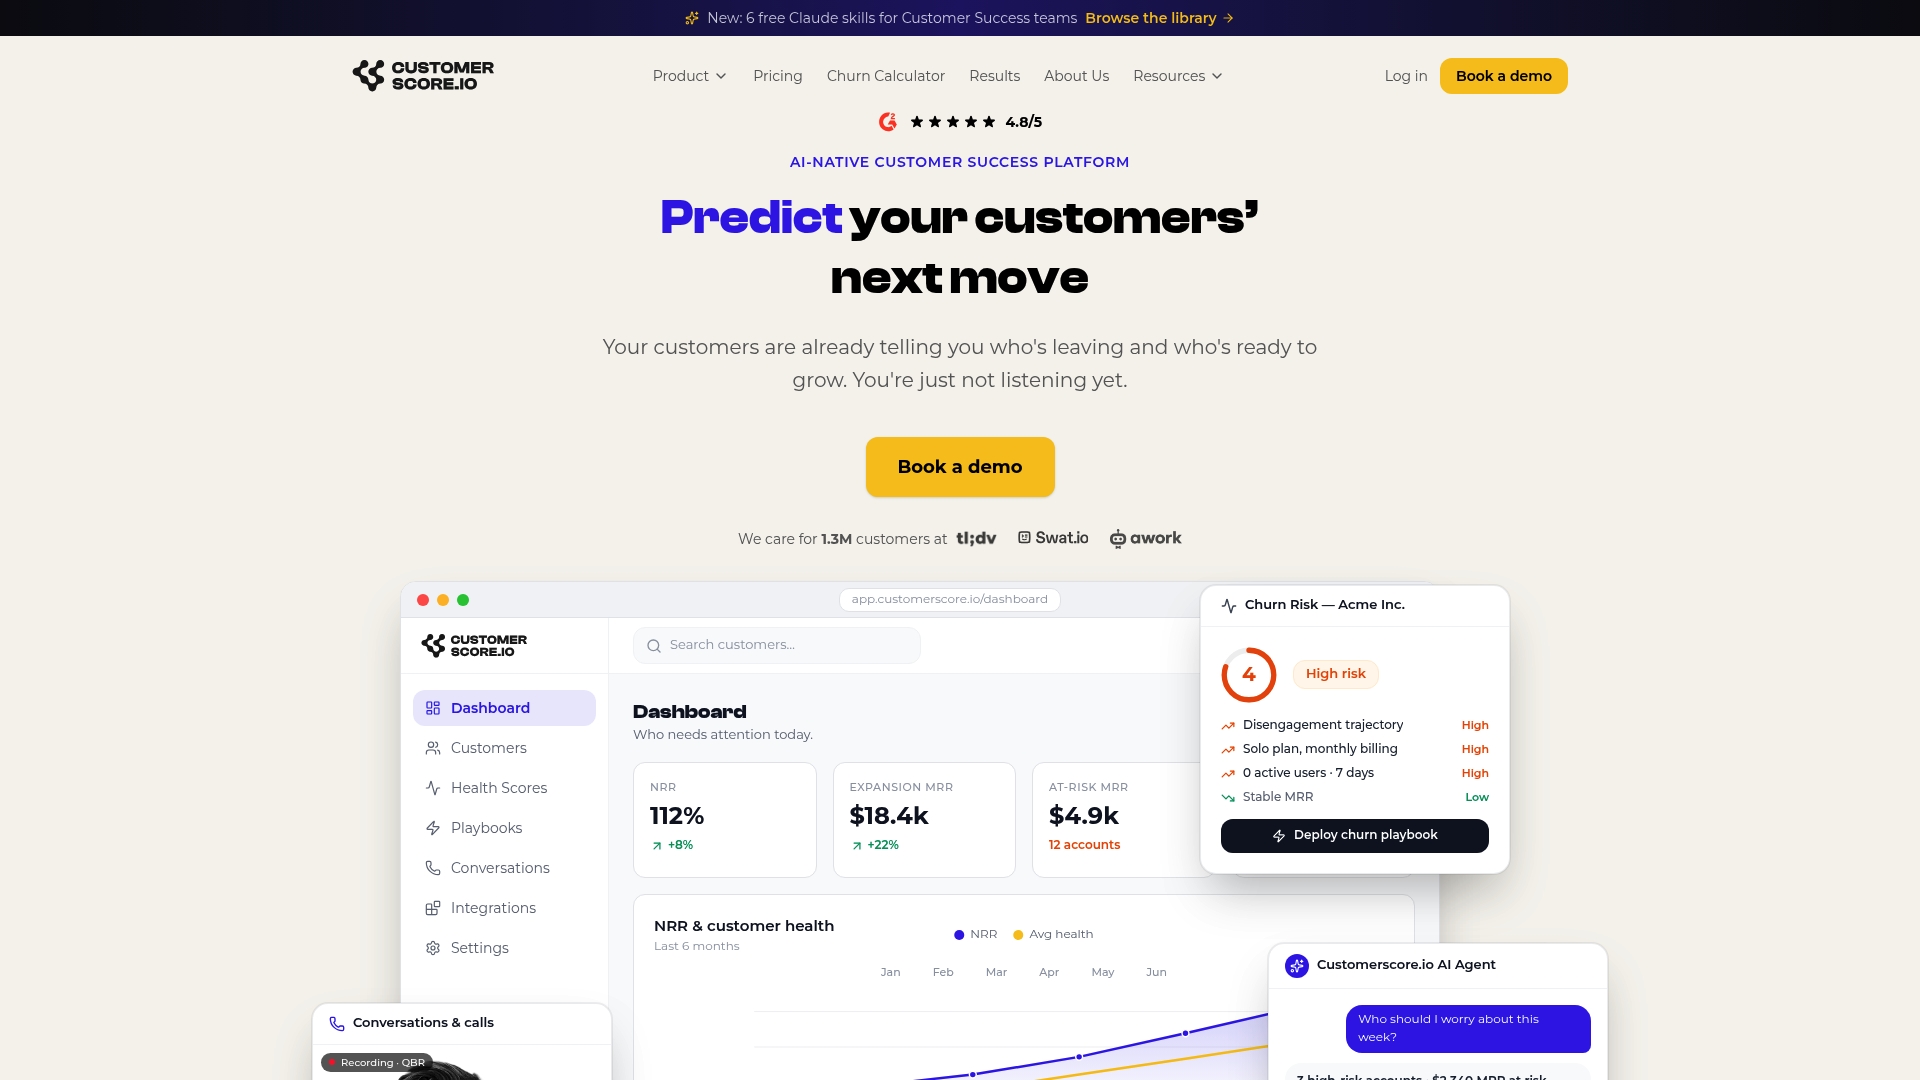
Customerscore connects your survey signals directly to automated playbooks, health scoring, and AI churn prediction so that a low CES score at onboarding or a Detractor NPS at renewal triggers the right action automatically, without a human having to notice it in a dashboard first. The platform pulls in data from HubSpot, Salesforce, Stripe, Intercom, Mixpanel, and Segment, so your health scores reflect behavioral signals alongside survey responses.
The result: your CS team spends time on accounts that need them, not on manually triaging survey exports. If you're building or rebuilding a CX measurement program for your B2B SaaS team, book a demo to see how Customerscore maps your NPS and CES signals to playbooks that actually close the loop.
Useful sources and further reading
The sources below back the claims in this article and are worth reading in full if you're building or auditing a CX measurement program.
- The One Number You Need to Grow — Harvard Business Review, Reichheld (2003). The original NPS paper; still the clearest statement of the metric's intent and limits.
- Stop Trying to Delight Your Customers — Harvard Business Review (2010). The foundational CES research; explains why effort reduction outperforms delight as a loyalty driver.
- Gartner: Reducing Customer Effort Improves Loyalty — Gartner (2013). Primary research backing CES as a loyalty predictor.
- Relational vs Transactional NPS — Qualtrics. Explains the distinction between periodic relationship surveys and event-triggered transactional surveys.
- NPS, CSAT and CES: When to Use Each — Retently. Practical guidance on metric selection and B2B SaaS use cases.
- Customer Effort Score — Nextiva. Overview of CES as a churn predictor with implementation notes.
- NPS vs CSAT vs CES: Key Differences — QuestionPro. Useful for teams building a multi-metric measurement stack.
- 5 Methods for Measuring Customer Satisfaction — Zendesk. Covers NPS calculation, question variants, and the case for pairing scores with qualitative follow-ups.
- Customer Satisfaction Metrics — SmartSurvey. Includes CES use cases for friction-heavy workflows like onboarding and claims resolution.
- Churn Prediction in SaaS — Customerscore. How behavioral and survey signals combine to build a predictive churn model.
- Customer Feedback and Revenue Growth — BabyLove Growth. Analysis of how structured feedback programs, including CES and NPS, connect to revenue outcomes.
Recommended
Related articles
90–120 Day Renewal System for CSMs: SaaS Renewal Playbook
90–120 Day Renewal System for CSMs: SaaS Renewal Playbook ! Team planning a structured SaaS renewal Run renewals as a 90 to 120 day managed pipeline, not a calendar reminder.
BlogCut Response Time 60% with This Slack for Customer Success Playbook
Cut Response Time 60% with This Slack for Customer Success Playbook ! Customer success team routing a Slack conversation Slack works best for customer success when it functions as the conversation
BlogProduct Led Customer Success in 90 to 180 Days Without a Data Team
Product Led Customer Success in 90 to 180 Days Without a Data Team ! Customer success operator reviewing product signals Product-led customer success uses product usage data and in-product
BlogPredict Churn 60–90 Days: Five Phase Customer Risk Scoring for B2B SaaS
Predict Churn 60–90 Days: Five Phase Customer Risk Scoring for B2B SaaS ! Customer success manager reviewing account risk dashboard Customer risk scoring produces a predictive, explainable health