
Building an Account Risk Taxonomy That Actually Predicts Churn


An account risk taxonomy is a classification system that sorts B2B SaaS accounts by churn, renewal, and expansion risk, then ties each classification to a specific action. Built correctly, it produces four things: a 0-100 composite risk score, red/amber/green tiers, root-cause tags (activation failure, ICP mismatch, payment issues), and a routing rule that sends each tier into a defined playbook.
The single biggest mistake teams make is skipping validation. Before you write a single weighting rule, pull 24 months of labeled account data (accounts that churned, renewed, and expanded) and run candidate signals through a logistic regression. If a signal doesn't correlate with historical outcomes, it doesn't belong in the model, no matter how intuitive it feels.
What a working taxonomy needs to output before you operationalize it:
- A composite score from 0 to 100, recalculated on a fixed cadence
- Three tiers (red, amber, green) with documented thresholds per segment
- Root-cause tags that explain why an account is at risk, not just that it is
- A playbook map that routes each tier and cause combination to a specific owner and action
Key Takeaways
An account risk taxonomy only works when its score is validated against real churn history and wired directly to a playbook with a named owner.
| Point | Details |
|---|---|
| Validate before you weight | Run logistic regression on 24 months of labeled data to confirm which of your 5 to 8 signals actually predict churn. |
| Use two axes for structure | Cross voluntary vs. involuntary risk with tenure at risk to route accounts to the right kind of intervention. |
| Build hard overrides | Force red tier automatically on failed payments or severity-1 tickets, regardless of the composite score. |
| Recalibrate on a fixed cadence | Assign a RevOps owner and recalibrate quarterly to keep accuracy from drifting as much as 8 to 12 points. |
| Put the scoring to work | Customerscore.io's explainable health scoring links root causes to the right next step, using your existing CRM and billing data. |
Table of Contents
- Account Risk Categories: Structuring the Taxonomy
- What Signals Should You Track for Account Health?
- How Do You Validate an Account Risk Model?
- From Score to Action: Wiring the Taxonomy Into Your Workflow
- Sources
Account Risk Categories: Structuring the Taxonomy
A usable taxonomy needs two axes, not one. The first axis is voluntary vs. involuntary churn risk. The second is tenure at risk (new accounts inside their first renewal cycle vs. mature accounts with renewal history). Cross these two axes and you get a matrix that tells your team not just that an account is red, but what kind of red it is and how urgently it needs a human.
Involuntary risk represents a significant portion of total churn and it's the cheapest to fix because voluntary and involuntary churn respond to completely different interventions: a failed card gets a dunning retry, not a CSM call. Voluntary risk requires actual diagnosis.
Your primary buckets should cover:
- Activation risk: the account never reached first value inside the expected onboarding window
- ICP mismatch: the account was sold outside your ideal customer profile and structurally can't get value
- Value decay: usage was strong, then declined, often tied to a workflow or team change
- ROI doubt: the account can't tie the product to a business outcome at renewal time
- Champion turnover: the internal advocate left or changed roles
- Support friction: repeated unresolved tickets or SLA breaches
- Payment failure: the account is involuntary risk, driven by billing, not sentiment
Allow multi-tagging for compound cases (a champion left and usage was already declining), but require one primary tag for reporting. Ambiguous cases, where the CSM genuinely isn't sure, should default to "value decay" until a renewal conversation confirms the real cause. Guessing wrong on the tag is far less costly than leaving it blank, because blank tags make your quarterly churn-by-cause report useless.
What Signals Should You Track for Account Health?
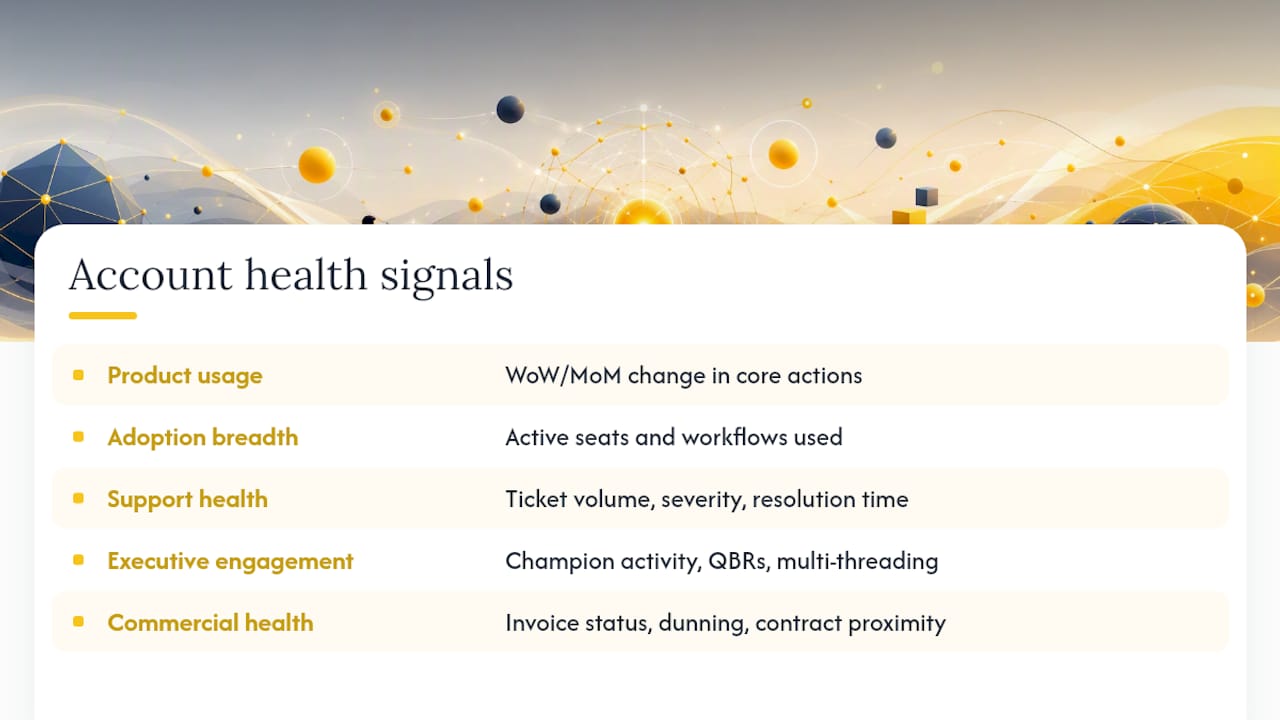
A defensible composite score rests on five signal categories, not fifteen. Each measures a genuinely different dimension of account health, and each should convert to its own 0-100 subscore before you blend them.
Product usage trend captures the direction of activity, not just the level: week-over-week or month-over-month change in core-action frequency. Adoption breadth and depth measures how many licensed seats are active and how many of the product's core workflows a team actually uses. Support health tracks ticket volume, severity, and resolution time, weighted toward unresolved and escalated tickets. Relationship and executive engagement covers champion activity, QBR attendance, and multi-threading depth across the account. Commercial and payment health flags invoice status, dunning stage, and contract term proximity.
To build the composite, normalize each category to a 0-100 subscore, then convert your regression coefficients into weights that sum to 100. A canonical mid-market starting point, adapted from patterns in health score models that blend usage, adoption, engagement, and support data, looks like this:
Some health score frameworks weight product usage even higher, putting it at 35% with commercial health closer to 10%. Your regression output should determine which starting point fits your actual churn data, not either template blindly.
Hard overrides matter more than the weighting itself. A failed payment, a severity-1 unresolved ticket, or a signed cancellation notice should force an account to red regardless of what the composite score says. Waiting for a weighted average to catch up to a payment failure defeats the point of having a taxonomy.
Pro Tip: Run your rule-based composite alongside a Random Forest classifier on the same dataset. The rule-based score stays explainable for CS conversations, while the ensemble model can catch nonlinear patterns the composite misses, giving you a modest accuracy lift without sacrificing the ability to explain a score to a customer.
How Do You Validate an Account Risk Model?
Building the taxonomy is the easy part. Proving it predicts anything requires a structured validation process, and skipping steps here is how teams end up with a scoring system nobody trusts by month three.
- Assemble the dataset. Pull trailing 24 months of account data with feature snapshots taken at month 3, month 6, and month 9 of the customer lifecycle, tagged with the actual outcome (churned, renewed, expanded).
- Engineer the features. Join product event streams to CRM and billing records, map open-text survey responses to your reason codes using a structured churn-reasons taxonomy built from combined event and survey data, build trailing-window trend features, and flag dunning and payment-retry events separately from voluntary signals.
- Run the regression. Logistic regression against the historical outcomes should surface 5 to 8 signals with p-values at or below 0.05. Convert the surviving coefficients into your weights and target a correlation above 0.7 against actual churn at a 60-day horizon.
- Add an ensemble layer if you need more lift. A Random Forest model trained on the same features can push predictive accuracy toward the 80% to 85% range at a 60-day horizon, compared to roughly 60% to 70% for a rule-based composite running alone.
- Calibrate your thresholds. Plot the actual churn rate by score band, then set red, amber, and green cutoffs where the churn curve actually breaks, not at arbitrary round numbers. Build a confusion matrix and check the ROC/AUC curve before locking thresholds, and document different cutoffs per segment if enterprise and mid-market accounts churn differently.
A regression-validated health score built on 5 to 8 weighted inputs typically flags at-risk accounts 30 to 90 days before contract risk becomes visible, and quarterly recalibration on fresh data improves accuracy by 8 to 12 percentage points over a static model. Assign a named RevOps owner to that recalibration cycle and keep a codebook documenting every threshold change and why it happened. A taxonomy nobody owns drifts out of date within two quarters.
From Score to Action: Wiring the Taxonomy Into Your Workflow
A score that doesn't trigger an action is a report, not a taxonomy. Every tier needs an owner, a deadline, and a defined playbook, or the whole exercise becomes a dashboard people glance at and ignore.
- Red tier: executive escalation within 24 hours, with the root-cause tag determining whether it goes to a CSM, a support lead, or finance
- Amber tier: CSM builds and executes an action plan within 7 days, targeted at the specific cause tag
- Green tier: monthly expansion outreach, since a healthy account is your best near-term upsell candidate
Route involuntary risk differently from voluntary risk. Payment failures should trigger automated dunning and retry sequences with no human touch until the second or third failed attempt. Voluntary risk (activation, value decay, champion turnover) needs a CSM running a root-cause playbook, because automation can't diagnose a relationship problem. Pairing your CRM with AI-driven support routing built for SaaS support volume can handle the involuntary side without adding headcount.
Define your SLAs and automation points explicitly: which score changes fire an alert, which alerts auto-create a CRM task, and which escalation rules apply when a red account has no CSM action logged within the deadline. Then measure whether any of it works. Track save rate by playbook, run a monthly churn breakdown by taxonomy category, and check whether CSMs are actually applying the tags consistently in your CRM. A taxonomy that sits in a spreadsheet while your CRM notes say "at risk, reason unclear" isn't operational yet.
Set a cadence and hold it: weekly review of every red account, monthly review of taxonomy trends and tag distribution, and a quarterly pass to recalibrate thresholds and A/B test playbook variants against a control group.
What Customerscore.io Recommends for Ownership and Rollout
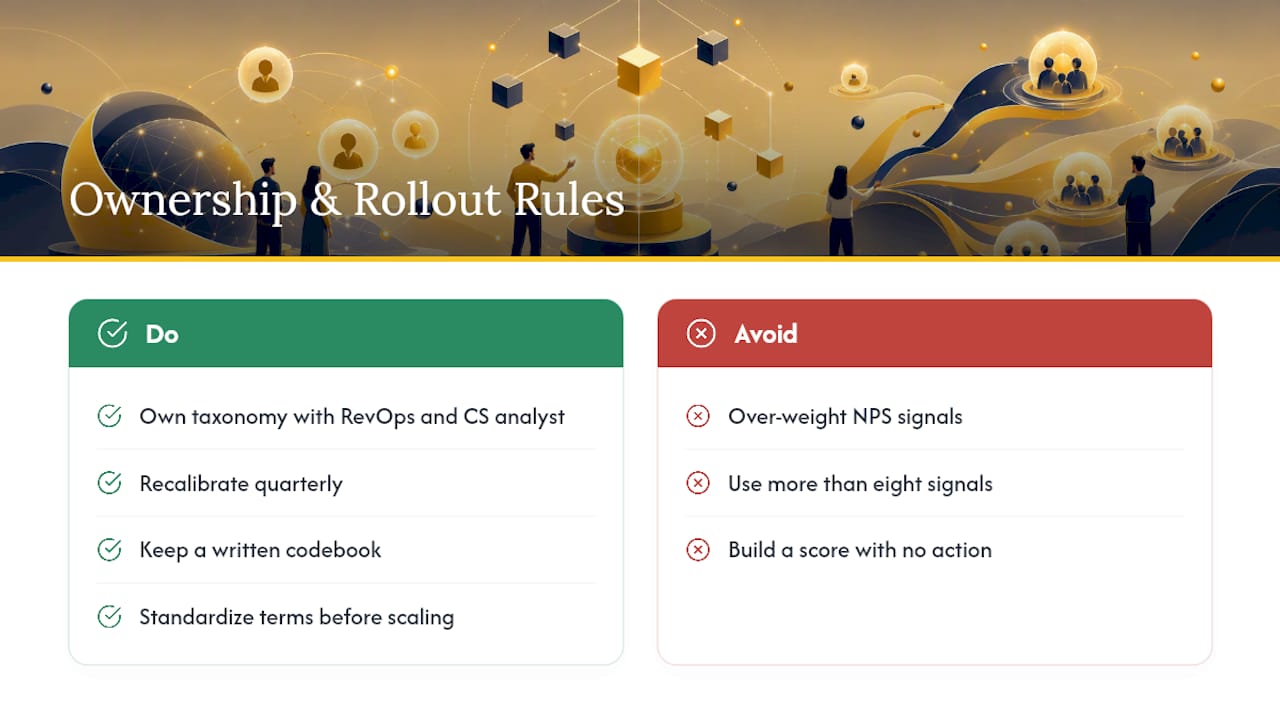
Own the taxonomy jointly between RevOps and a CS analyst, not inside a single CSM's head. Recalibrate quarterly and keep a written codebook so every threshold change has a documented reason.
The traps we see most often: teams over-weight NPS despite its low response rate and volatility, they pile on more than eight signals until signal-to-noise collapses, and they build a beautiful score that never triggers a single playbook action. A score with no wired action is just a dashboard. For templates, check Customerscore's account health dashboard guide and customer success glossary to standardize your codebook terms before you scale the model across segments.
Patrik
Put Your Taxonomy on Autopilot With Customerscore
A taxonomy on a spreadsheet still needs someone to update it every month, chase down the usage data, and remember which accounts crossed a threshold last week. Customerscore replaces that manual loop with explainable AI health scoring that pulls product usage, billing, CRM, and support data into one composite score automatically, with the root-cause tags and playbook routing built in rather than bolted on after the fact.
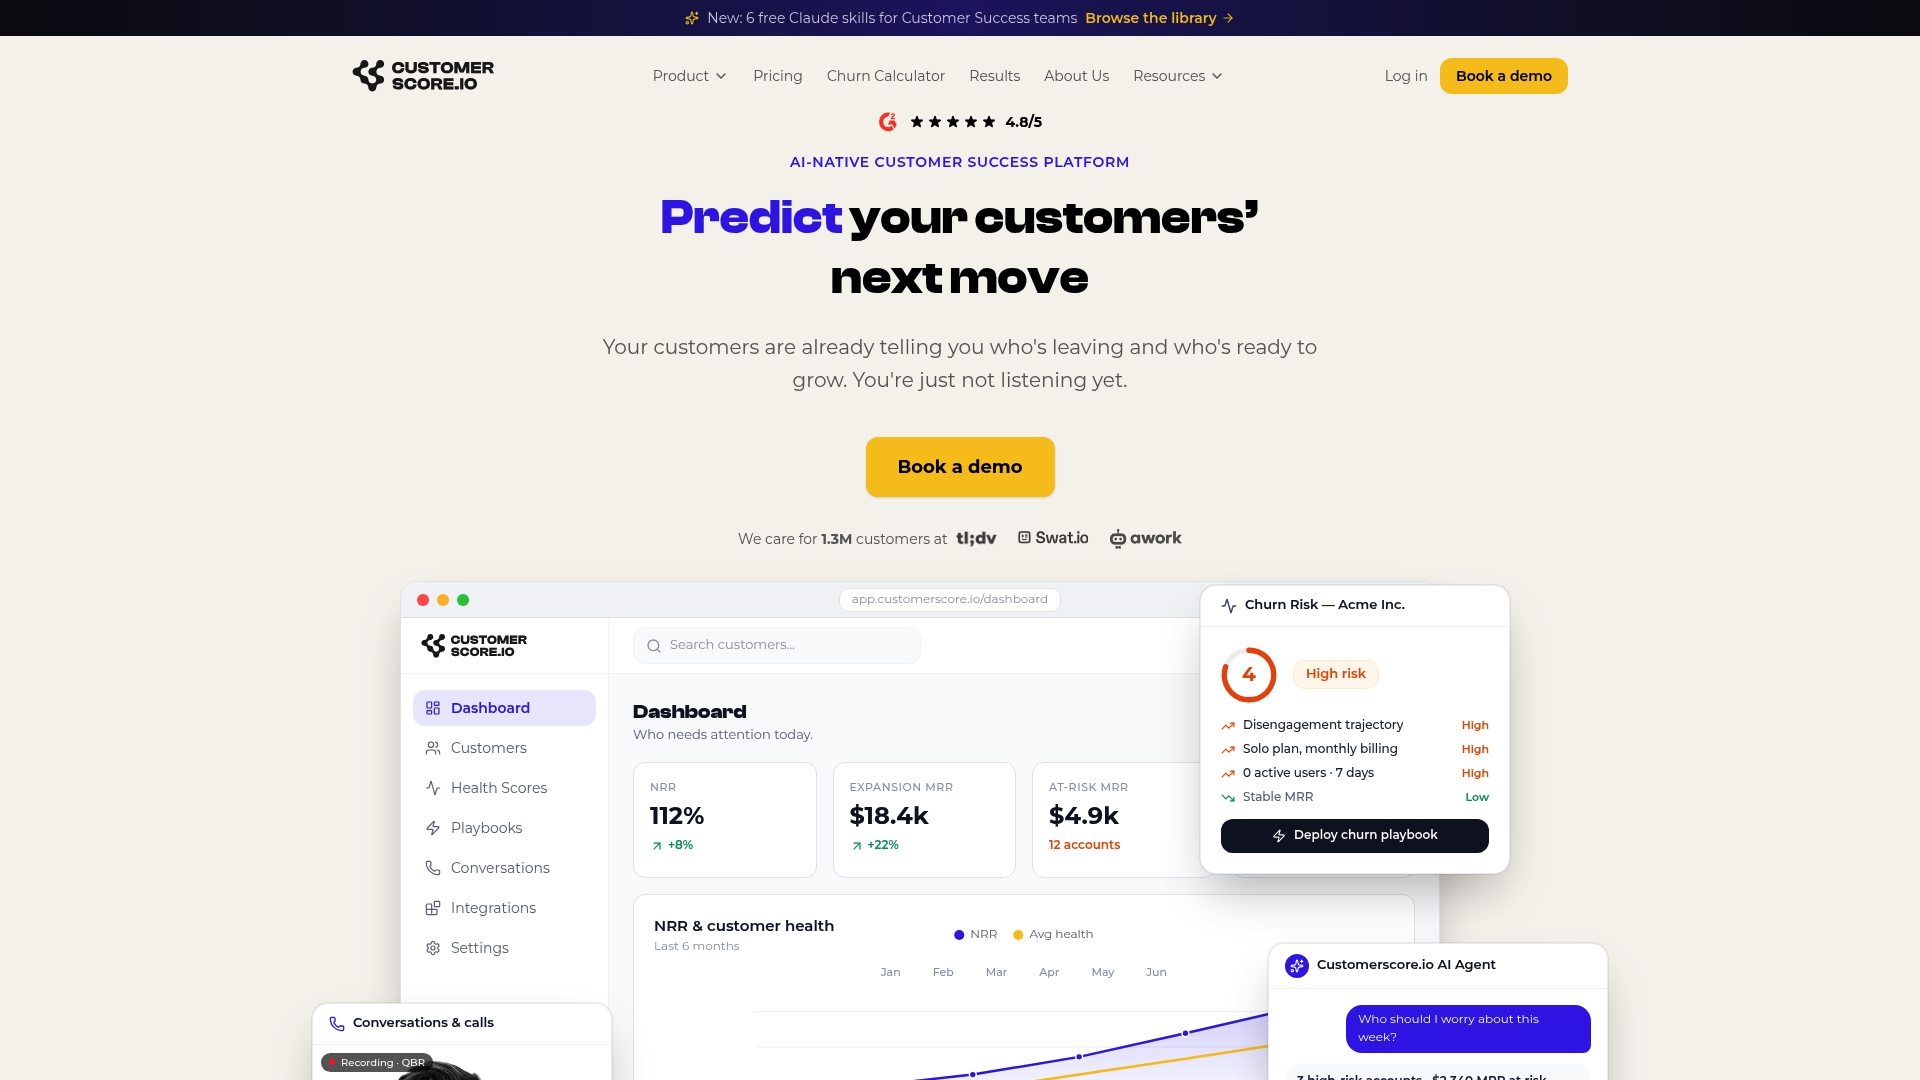
You get AI-driven churn prediction that flags red accounts before the renewal conversation, not during it, plus native integrations with HubSpot, Salesforce, Stripe, Chargebee, and Intercom, so your taxonomy runs on the data you already have. If you're still validating your model by hand in a spreadsheet, that's exactly the gap this closes. Evaluate the AI churn prediction software or book a demo to see your own accounts scored and tiered before your next quarterly business review.
Sources
- Customer Health Score: Building an Early Warning System for Churn
- How to Build a Churn Reasons Taxonomy from Event Streams & Survey Data (2025 Guide)
- Saasdash
- How to build a customer health score | Basedash
Recommended
Related articles
Five Fields to Fix Playbook Trigger Design for B2B SaaS CS & RevOps
Five Fields to Fix Playbook Trigger Design for B2B SaaS CS & RevOps ! Isometric trigger routing system illustration The most reliable approach to playbook trigger design is to sort every alert into
BlogStop SaaS Downgrades: Save 31% of At Risk Accounts for CS & RevOps
Stop SaaS Downgrades: Save 31% of At Risk Accounts for CS & RevOps ! Isometric account protection title card The fastest way to prevent SaaS downgrades is to stop treating every at-risk account the
Blog24–48 Hour Handoffs: B2B SaaS Support to CS Checklist, Six Fields
24–48 Hour Handoffs: B2B SaaS Support to CS Checklist, Six Fields ! Isometric handoff cards crossing between platforms A reliable support to CS handoff transfers ownership and context so the new owner
Blog90–120 Day Explainable AI Playbook to Reduce Renewal Risk for SaaS CS
90–120 Day Explainable AI Playbook to Reduce Renewal Risk for SaaS CS ! Isometric illustration of explainable renewal risk decisions To reduce renewal risk, you prioritize accounts daily using