
30–60 Day Rule: When to Use CSAT vs NPS for SaaS Stages


CSAT and NPS aren't competing for the same job. CSAT tells you whether a specific interaction, like onboarding or a support ticket, worked; NPS tells you whether customers would stake their reputation on recommending you. Most SaaS teams need both: CSAT as the operational signal that drives fixes, NPS as the strategic pulse leadership tracks quarter over quarter. If you're pre-product-market fit and have to pick one, start with CSAT. Add NPS once usage is stable and retention becomes a real goal.
TL;DR:
- Most SaaS teams should use CSAT for operational fixes during early stages and add NPS once usage stabilizes to track loyalty trends.
- NPS responses are highly volatile with small sample sizes and should only be reported after reaching a minimum respondent threshold of about 30 to 50 per segment.
- Running both metrics simultaneously requires careful survey trigger management to avoid contaminating data and ensure accurate signals for support and renewal actions.
- Both CSAT and NPS should be owned by different teams, with clear SLAs and automated alerts to prevent unaddressed low scores from skewing analysis.
- A strong SaaS performance benchmark combines CSAT above 85% and NPS over +50, with NPS serving as a quarterly strategic indicator of customer loyalty.
Table of Contents
- CSAT vs NPS SaaS: What Each Metric Actually Measures
- How Do You Calculate CSAT for SaaS?
- How Do You Calculate NPS and Avoid Sample-Size Traps?
- When Should SaaS Teams Use CSAT vs NPS?
- How Do You Run CSAT and NPS Together Without Confusing the Data?
- What Mistakes Break CSAT and NPS Programs?
- What Survey Questions Actually Get Useful Answers?
- What Do Your Scores Actually Mean for Retention?
- Why Chasing One Perfect Score Is the Wrong Goal
- See How Customerscore Turns Survey Signals Into Retention Wins
- Sources
- FAQ
CSAT vs NPS SaaS: What Each Metric Actually Measures
CSAT and NPS answer different questions, and confusing them is the most common mistake product and customer success teams make when building a feedback program.
CSAT (Customer Satisfaction Score) is a transactional metric. You ask it right after a specific event: closing a support ticket, finishing onboarding, using a new feature. The typical question reads something like "How satisfied were you with [interaction]?" on a 1-to-5 scale, and it's a snapshot of how that one moment went, not how the customer feels about your company overall.
NPS (Net Promoter Score) is relational. It asks "How likely are you to recommend [product] to a colleague?" on a 0-to-10 scale, and it's built to capture loyalty accumulated over months of experience. Respondents split into three bands: promoters (9 to 10), passives (7 to 8), and detractors (0 to 6). NPS is the percentage of promoters minus the percentage of detractors, which produces a score from negative 100 to positive 100.
The distinction between transactional and relational feedback is the whole reason CSAT and NPS coexist instead of replacing one another.
- CSAT answers: "Did this specific touchpoint work?"
- NPS answers: "Does this customer trust us enough to vouch for us?"
- CSAT limitation: noisy at low volume and blind to overall relationship health.
- NPS limitation: slow to move, easy to over-interpret from small samples, and useless for diagnosing a single bad support flow.
How Do You Calculate CSAT for SaaS?
CSAT calculation is simpler than most teams make it, but the standard mistake, averaging raw scores, quietly wrecks the signal.
The standard approach uses a top-two-box method rather than a mean:
- Ask a 1 to 5 satisfaction question immediately after the interaction.
- Count everyone who answered 4 or 5 as "satisfied."
- Divide satisfied responses by total responses, then multiply by 100.
That gives you a percent-satisfied score, which is the calculation method IBM recommends over a raw average because averaging treats a 3 and a 1 as meaningfully different when both really mean "not satisfied."
Segment before you report. Break results down by flow, agent, and plan tier, and you'll usually find the real problem is one broken flow dragging the whole number down.
Pro Tip: Build a rolling 30-day CSAT trend line per flow, not a single all-time number. A flat aggregate score can hide a support queue that just got worse and a self-serve flow that just got better.
How Do You Calculate NPS and Avoid Sample-Size Traps?
NPS math is one subtraction: percentage of promoters minus percentage of detractors.
Passives (scores of 7 or 8) don't count in either direction, but don't ignore them. They're customers who are satisfied enough to stay quiet and unsatisfied enough to leave the moment a competitor makes a better pitch.
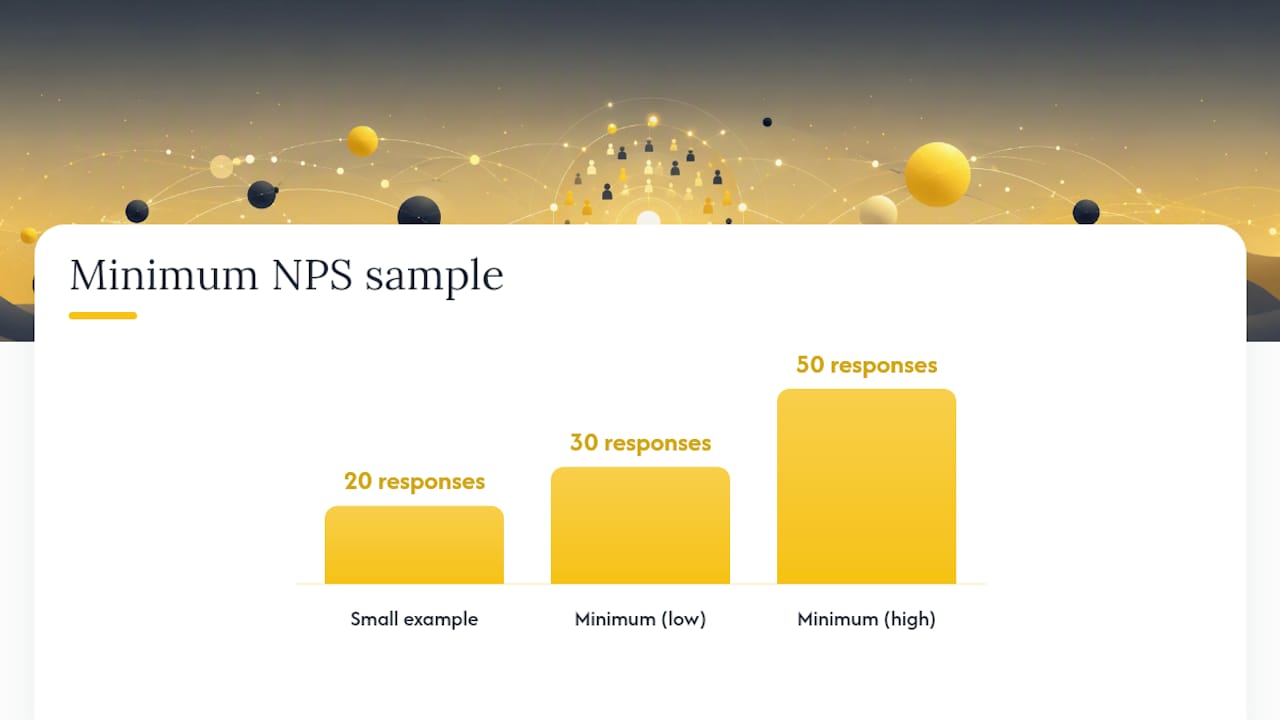
The bigger trap is sample size. NPS is genuinely volatile with modest respondent counts, and a shift from +40 to +25 based on 20 responses is closer to statistical noise than a real trend.
- Set a minimum response threshold (often 30 to 50 per segment) before reporting a change to leadership.
- Report NPS by ARR tier, since enterprise and self-serve customers rarely feel the same way about your product.
- Track NPS by product module if you sell a multi-product suite, since one weak module can drag down an otherwise strong score.
- Segment by renewal cohort to catch loyalty erosion before it shows up as churn.
A useful benchmark to hold in your head: B2B SaaS teams see a median NPS around +36, with top-quartile performers clearing +50. If your last quarterly reading swung 15 points on a small sample, treat it as a flag to investigate, not a fact to present.
When Should SaaS Teams Use CSAT vs NPS?
The right metric depends less on preference and more on where your company sits.
Pre-product-market fit, CSAT should carry most of the weight. You're iterating fast, and CSAT gives you interaction-level feedback quickly enough to act on before your next release. NPS at this stage is often statistically meaningless: you don't have enough stable, long-tenured users to make the relational question mean anything.
Once you hit product-market fit and have steady usage, add NPS, leveraging email marketing for SaaS to support survey follow-ups and retention workflows. This is when leadership starts asking about retention and expansion, and NPS becomes the strategic pulse that anchors board conversations and renewal forecasting. In the growth stage, layer in Customer Effort Score (CES) alongside both, since CES captures friction that neither CSAT nor NPS is built to isolate.
Here's where each metric earns its keep in practice:
- CSAT: onboarding completion, support ticket resolution, feature release feedback, self-serve checkout flow.
- NPS: quarterly relationship check-ins, renewal windows, executive business reviews, annual account health surveys.
Some sources frame a "good" NPS more loosely, but the consensus for B2B SaaS specifically is that anything above +50 counts as excellent, not just "above zero."
How Do You Run CSAT and NPS Together Without Confusing the Data?
Running both metrics at once is where most programs fail, not because the math is hard, but because the triggers overlap and pollute each other's signal.
- Trigger CSAT off specific events: ticket closure, onboarding completion, feature adoption. Never on a fixed calendar.
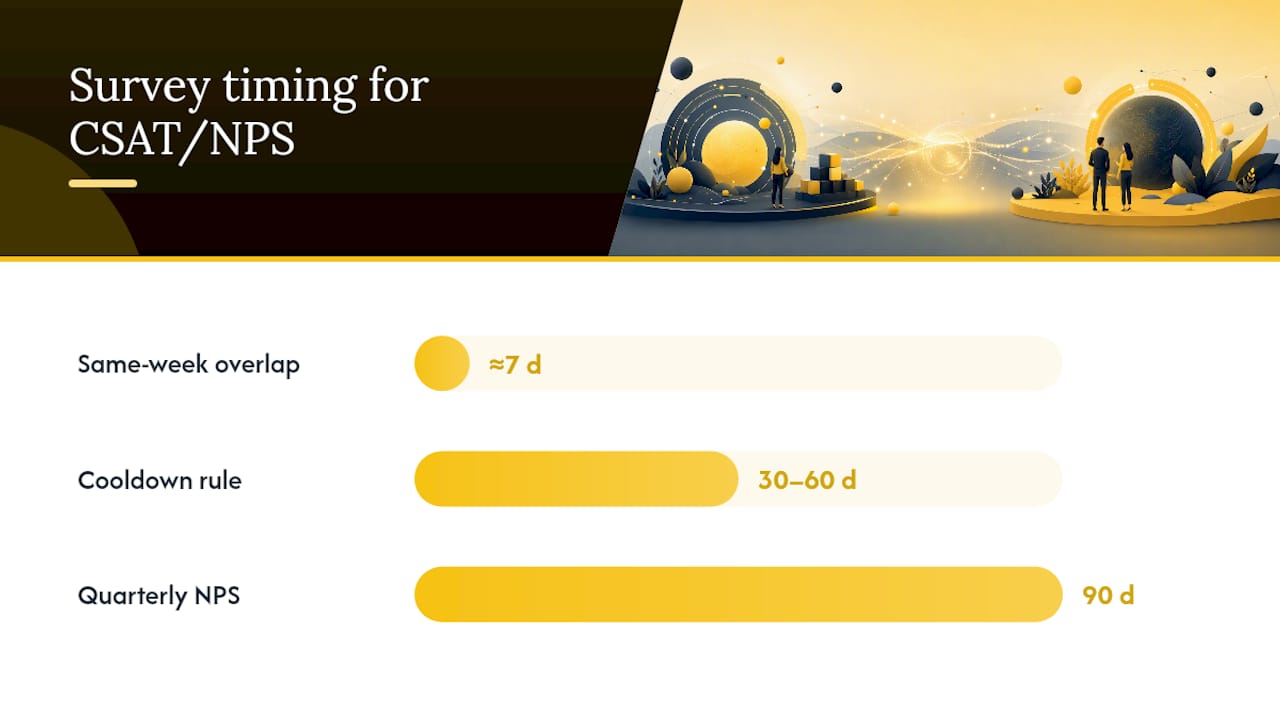
- Trigger NPS on a time-based cadence, typically quarterly, or at a fixed milestone like a renewal window.
- Apply a cooldown rule, often 30 to 60 days, so the same user isn't hit with both surveys in the same week.
- Route every low CSAT score and every detractor NPS response into an automatic alert, not a spreadsheet someone checks on Fridays.
- Send those alerts to the right owner, whether that's a support lead in Slack or a customer success manager in your CRM, with a playbook attached.
Mixing cadences, asking a relational NPS question right after a transactional support interaction, dilutes both signals. The customer answers the NPS question based on their mood from the ticket, not their actual loyalty, and you get a number that looks precise but means nothing.
The fix that actually moves retention numbers is closed-loop automation. Programs without automatic routing from survey result to owner to playbook rarely reduce churn, because by the time a human notices the low score in a report, the customer has already mentally checked out.
Pro Tip: Tag every open-ended follow-up response with a root-cause category (billing, bug, missing feature, poor support) at the moment it comes in. Six months of untagged verbatims is a graveyard, not a dataset.
For teams building this out, a structured product feedback loop that ties survey triggers to sprint planning tends to outperform ad hoc Slack alerts within a quarter or two.
What Mistakes Break CSAT and NPS Programs?
Most broken survey programs share the same three failure modes, and none of them are exotic.
- Mixing cadences: firing an NPS survey right after a support ticket, which contaminates the relational score with transactional mood.
- Averaging CSAT instead of using top-two-box: this makes a string of mediocre 3s look identical to a healthy mix of 5s and the occasional 1.
- Treating a 20-response NPS swing as a trend: small-sample noise gets reported to leadership as if it were signal.
- No follow-up SLA: a detractor response that sits untouched for two weeks tells the customer their feedback doesn't matter.
Governance fixes most of this. Assign clear ownership: product owns CSAT tied to features, support owns CSAT tied to tickets, customer success owns NPS. Set an SLA, commonly 24 to 72 hours for low CSAT and 48 hours for detractor NPS, and define escalation thresholds so a cluster of low scores automatically triggers an account review instead of waiting for someone to notice.
A skewed, tiny sample is worse than no data, because it looks authoritative and isn't.*
What Survey Questions Actually Get Useful Answers?
Wording determines whether you get a usable score or a shrug. A few templates worth copying directly:
CSAT templates:
- Support: "How satisfied were you with the help you received today?" (1 to 5) followed by "What could we have done better?"
- Onboarding: "How satisfied are you with your setup experience so far?" (1 to 5) followed by "What almost stopped you from finishing setup?"
- Feature release: "How satisfied are you with [feature]?" (1 to 5) followed by "What would make this more useful?"
NPS template:
- "How likely are you to recommend [product] to a colleague?" (0 to 10), sent quarterly or at renewal, with the open follow-up: "What's the main reason for your score?"
Add Customer Effort Score when the goal is friction, not sentiment: "How easy was it to complete [task]?" on a 1-to-7 scale. Use CES alongside CSAT anywhere users hit a multi-step process, like migrating data or configuring an integration, since it isolates effort in a way satisfaction questions don't catch.
What Do Your Scores Actually Mean for Retention?
Reading CSAT and NPS side by side reveals problems that neither metric shows alone. Four common patterns map to distinct fixes:
- High CSAT, low NPS: support is great, but the product itself doesn't inspire loyalty. Route to product strategy.
- High NPS, low CSAT: customers love the vision but hate day-to-day friction. Route to support or onboarding.
- High CSAT, low CES: interactions feel good but take too much effort. Route to UX and workflow design.
- Falling NPS in a renewal cohort: trigger an account review within 48 hours, not at the next quarterly business review.
For leadership, present NPS as the trend line that frames the strategic story, and back it with CSAT-driven evidence, specific flows fixed, specific tickets closed, when explaining why the number moved. A combined view of customer success metrics tends to land better in a board slide than either number alone.
Why Chasing One Perfect Score Is the Wrong Goal
Teams waste months debating whether CSAT or NPS is the "real" metric. It's the wrong argument. Both are complementary layers, not competitors: CSAT drives the weekly fixes, NPS frames the quarterly story, and neither replaces the other.
The actual competitive advantage isn't picking the right metric. It's closing the loop every time, consistently, until follow-up becomes a habit instead of a project. Get your team aligned on ownership before you launch either survey, or you'll end up with a dashboard nobody trusts and a leadership team treating scores as vanity KPIs.
— Patrik
See How Customerscore Turns Survey Signals Into Retention Wins
Closed-loop automation is the hard part of any CSAT or NPS program, and it's exactly where most teams get stuck manually routing alerts through spreadsheets and Slack messages that go stale.
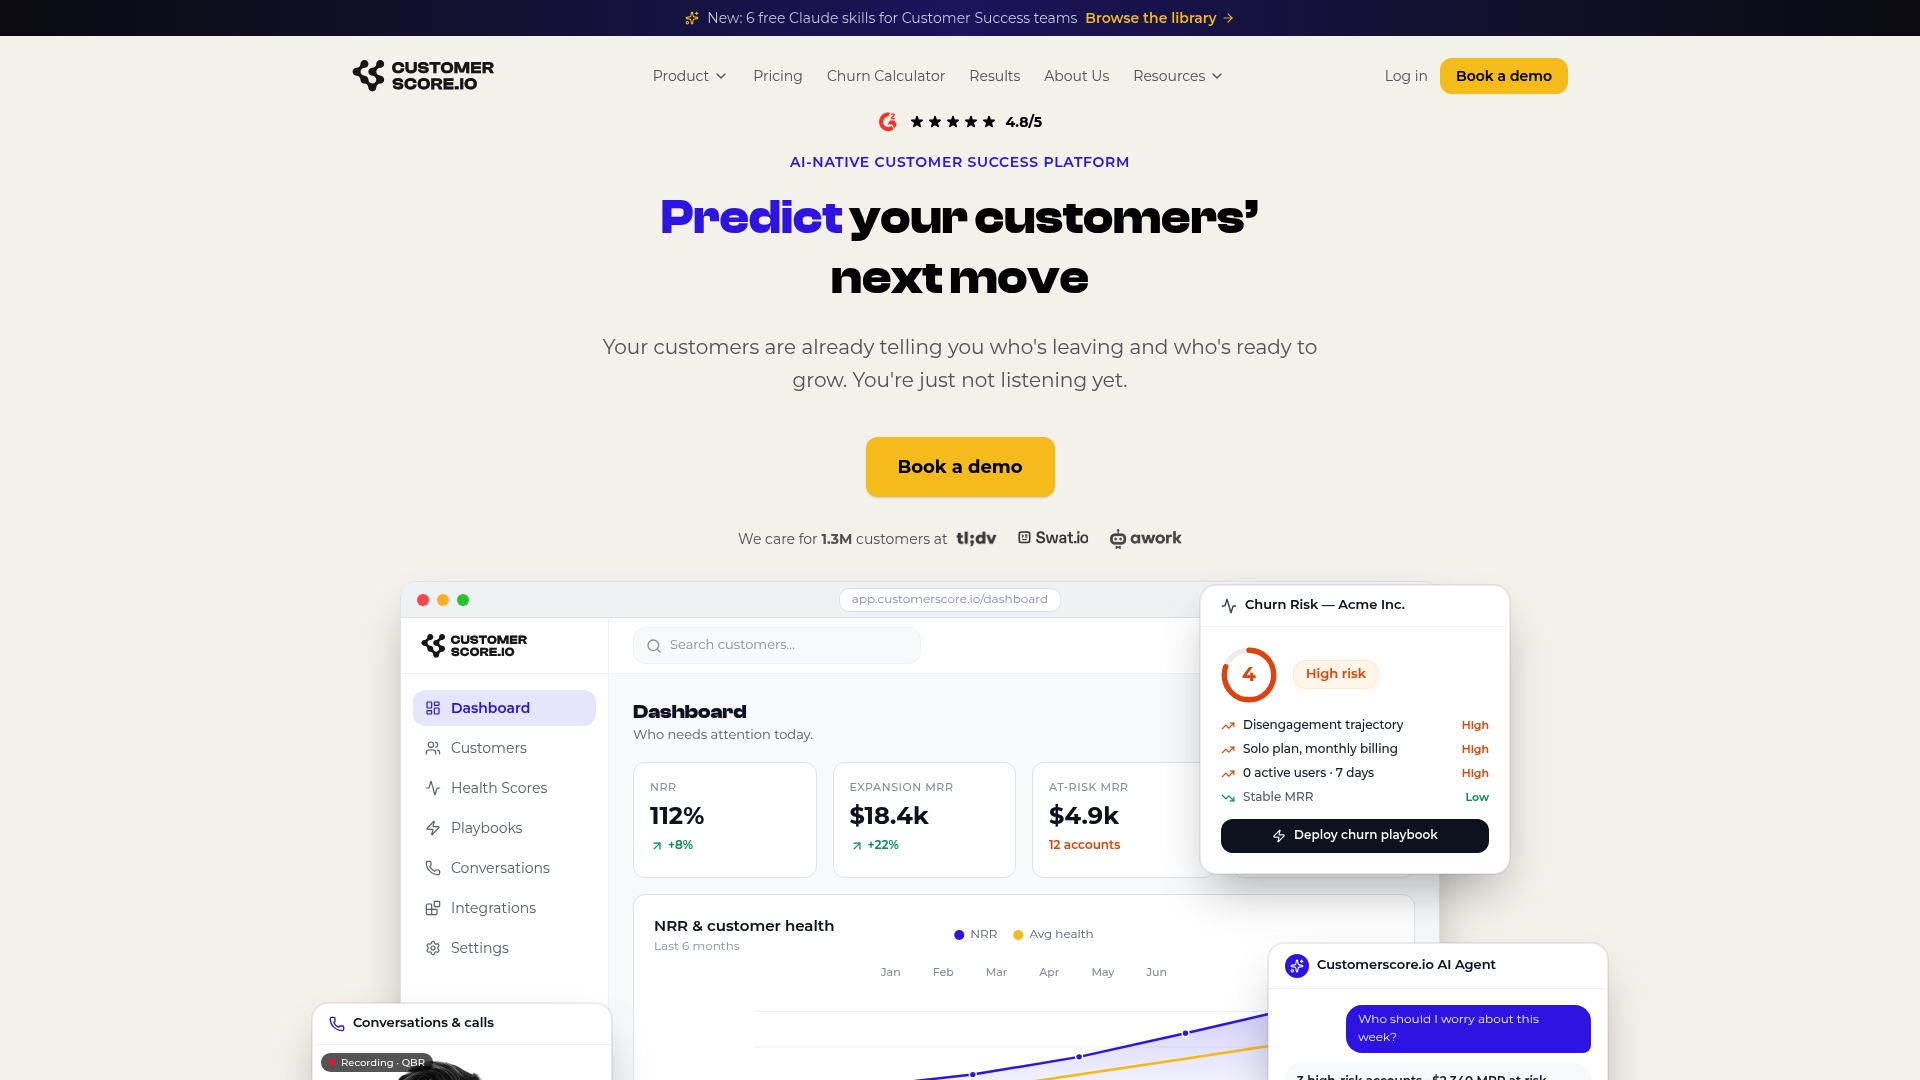
Customerscore connects your survey data with billing, product usage, CRM, and support signals to build explainable health scores that flag at-risk accounts before a detractor score even shows up in a report. Its AI churn prediction engine turns a low CSAT ticket or a detractor NPS response into an automatic playbook, routed to the right owner in HubSpot, Salesforce, or Slack, with a follow-up SLA already attached. If you're currently piecing this together across five different tools, book a demo and see what a single VoC pipeline looks like when the alerts actually turn into saved accounts.
Sources
- CSAT vs NPS: which customer satisfaction metric to use
- CSAT vs NPS: Key Differences, Scores and Survey Questions
- CSAT NPS CES Benchmarks for SaaS Support 2026
FAQ
Which Is Better, NPS or CSAT?
Neither is universally better; they measure different things. CSAT is the better tool for fixing a specific interaction, while NPS is the better tool for tracking overall loyalty over time.
What Is a Good NPS Score for SaaS?
A median B2B SaaS NPS sits around +36, with top-quartile companies scoring +50 or higher. Anything above +50 is generally considered excellent for the category.
What Is a Good CSAT and NPS Score Combined?
Strong B2B SaaS performance looks like CSAT around 85% or higher paired with NPS at +50 or above, based on top-quartile benchmark data.
Should Pre-Launch SaaS Companies Track NPS?
Generally no. Teams without product-market fit get more value from CSAT, since it delivers fast, interaction-level feedback while NPS needs stable usage volume to mean anything.
How Often Should SaaS Teams Send NPS Surveys?
Quarterly is the standard cadence for most B2B SaaS companies, often aligned with renewal cycles. Sending it more frequently risks survey fatigue and adds noise without adding real signal.
Recommended
Related articles
90–120 Day Renewal System for CSMs: SaaS Renewal Playbook
90–120 Day Renewal System for CSMs: SaaS Renewal Playbook ! Team planning a structured SaaS renewal Run renewals as a 90 to 120 day managed pipeline, not a calendar reminder.
BlogCut Response Time 60% with This Slack for Customer Success Playbook
Cut Response Time 60% with This Slack for Customer Success Playbook ! Customer success team routing a Slack conversation Slack works best for customer success when it functions as the conversation
BlogProduct Led Customer Success in 90 to 180 Days Without a Data Team
Product Led Customer Success in 90 to 180 Days Without a Data Team ! Customer success operator reviewing product signals Product-led customer success uses product usage data and in-product
BlogPredict Churn 60–90 Days: Five Phase Customer Risk Scoring for B2B SaaS
Predict Churn 60–90 Days: Five Phase Customer Risk Scoring for B2B SaaS ! Customer success manager reviewing account risk dashboard Customer risk scoring produces a predictive, explainable health