
Renewal Forecasting for RevOps and CS Teams


The most reliable renewal forecast is an account-level, probability-weighted pipeline that blends commercial signals (billing data, contract terms, CRM opportunities) with behavioral signals (product usage, support history, executive engagement) and runs on a weekly operational, monthly refresh, quarterly calibration cadence. That structure beats spreadsheets and gut-feel because it surfaces at-risk accounts weeks earlier, gives finance a defensible number, and turns CS intuition into a shared, measurable hypothesis.
Your first concrete step is to build a 12-month rolling renewal schedule in a canonical contract table, tag an owner to every account renewing in the next 90 days, and run your first weekly review before the week is out. Everything else in this guide builds on that foundation.
Key Takeaways
Accurate renewal forecasting requires account-level probability weighting, two-layer data (commercial plus behavioral), and a weekly-monthly-quarterly operating cadence that closes the loop between forecast and actual outcomes.
| Point | Details |
|---|---|
| Build a 12-month rolling pipeline | Tag every renewal with an owner and run the first weekly review before the week ends. |
| Blend commercial and behavioral signals | Contract data tells you when; usage, support, and engagement data tell you whether. |
| Run three cadence layers | Weekly for near-term saves, monthly to refresh inputs, quarterly to recalibrate probabilities. |
| Track forecast accuracy as a KPI | Publish predicted vs. actual renewal ARR every quarter and recalibrate any bucket that misses by more than 15 points. |
| Customerscore automates the two-layer model | Multi-source integrations, explainable health scoring, and built-in save-plan workflows replace manual spreadsheet tracking. |
Table of Contents
- What is renewal forecasting and why does it matter for SaaS?
- Why spreadsheets and gut-feel break your renewal forecast
- What data do you actually need for accurate renewal forecasting?
- Which forecasting method fits your situation?
- How to build your renewal forecast: a step-by-step timeline
- How to turn forecasts into retention action
- Which KPIs belong in your renewal forecast dashboard?
- Red flags and data-quality checks to keep forecasts honest
- Why cadence and the two-layer data rule are the real differentiators
- The adoption challenge nobody talks about
- Customerscore turns your renewal data into a repeatable forecast
- Sources
What is renewal forecasting and why does it matter for SaaS?
Renewal forecasting is the process of predicting how much of your existing subscription or contract revenue will be renewed in a given period. The core output is simple: account ARR (or MRR) multiplied by renewal probability, summed across all accounts renewing in the window. As KnowMBA explains, the standard approach is an account-by-account weighted pipeline with probability buckets: Commit (above 80%), Likely (60–80%), At-Risk (30–60%), and Best-Case (below 30%). Expected renewal revenue is the sum of each account's ARR times its assigned probability.
That number matters to three different teams for three different reasons.
- Customer Success uses it to prioritize save plans and QBR scheduling for the accounts most likely to churn.
- Finance uses it for cash planning, headcount modeling, and board reporting, where a surprise miss in renewal revenue is far more damaging than a miss in new ARR.
- RevOps uses it to track gross renewal rate and net revenue retention (NRR) over time, calibrate model accuracy, and align CS and Sales on shared assumptions.
The outputs also map directly to staffing decisions.
Why spreadsheets and gut-feel break your renewal forecast
The most common failure mode is not a bad model. It is a model that was never really a model at all: a spreadsheet with a single historical renewal rate applied to every account and updated once a quarter when the CFO asks for a number.
Three specific traps kill forecast accuracy.
Applying one rate to both produces a number that is wrong for every segment.
Gut-feel probability is optimistically biased. CSMs consistently over-estimate renewal probability on accounts they own because they have a relationship with the contact and assume that relationship equals intent to renew. Behavioral signals (declining login frequency, unresolved support tickets, no executive sponsor activity in 60 days) tell a different story, and they tell it earlier.
Late-stage-only reviews miss the intervention window. Starting a renewal review 30–60 days before the contract date is too late for any meaningful save plan. By then, the customer has already evaluated alternatives, the budget conversation has happened internally, and your leverage is limited to discounting.
A forecast that lives only in a CSM's head is not a forecast. It is a hope with a date attached. The moment you make assumptions explicit, assign them to owners, and track whether they proved true, you have something a finance team can actually plan around.
Pro Tip: Make every probability assumption explicit and measurable. Write down what "Likely" means in your business, for example, "logged in at least 3 times in the last 30 days, no open P1 tickets, exec sponsor engaged in last 45 days." When assumptions are documented, the forecast becomes a shared hypothesis the whole team can test and improve.
What data do you actually need for accurate renewal forecasting?
Reliable renewal prediction modeling runs on two layers of data. Miss either layer and your forecast will be structurally incomplete.
Commercial layer (the contract and billing record):
- Active contract terms, renewal dates, and notice periods
- Current ARR or MRR per account, including any amendments
- CRM opportunity stage for the renewal deal
- Payment status: current, past-due, or failed
- Expansion and contraction history
Behavioral layer (the usage and relationship record):
- Product login frequency and active seat count versus licensed seats
- Feature adoption depth (are they using the features tied to their stated use case?)
- Support ticket volume, severity, and resolution time
- Executive sponsor activity: last meeting date, QBR attendance, email response rate
- NPS or CSAT scores and trend direction
Stripe's SaaS revenue forecasting guide reinforces this: reliable models ground themselves in MRR/ARR, churn trends, and usage rates, and they combine multiple modeling approaches depending on data maturity. Neither layer alone is sufficient. Commercial data tells you when the renewal is due; behavioral data tells you whether it will happen.
Essential metrics to track:
- MRR and ARR by account and cohort
- Renewal rate (gross and net)
- Gross renewal rate (GRR): revenue retained before expansion
- Net revenue retention (NRR): revenue retained including expansion and contraction
- Logo churn vs. revenue churn (these diverge significantly in enterprise books)
- Health score composite and trend
Data hygiene checkpoints before you build:
- Single source of truth for ARR/MRR (billing system wins over CRM when they conflict)
- Deduplicated contracts (one row per active subscription, not one per invoice)
- Renewal dates aligned between billing and CRM
- Payment failure flags surfaced in real time, not in a monthly reconciliation
Which forecasting method fits your situation?
No single method works for every SaaS business. The right choice depends on your contract mix, data maturity, and how many accounts you are managing. Cohort-based models improve long-term retention visibility because different cohorts (by signup date, plan, or acquisition channel) show distinct renewal and expansion patterns.
| Method | Best for | Data needs | Accuracy at scale | Speed to implement | Key pitfall |
|---|---|---|---|---|---|
| Historical average | Early-stage, small account count | Renewal history only | Low | Fast | Hides cohort differences |
| Cohort retention | Mid-market, plan or channel mix | Cohort-tagged contract history | Medium | Medium | Requires clean cohort labels |
| MRR buildup | Any stage with account-level data | Contract + CRM per account | High | Medium | Labor-intensive without tooling |
| Usage-based model | PLG or usage-priced products | Product event data | High | Slow | Needs instrumented product |
| Field-weighted (CSM + signals) | Enterprise, small account count | CSM input + behavioral signals | Medium | Fast | Optimistic bias without signal checks |
| Predictive ML | Scale (100+ accounts), data-mature | Labeled historical outcomes | Very high | Slow | Requires stable labeled history |
The practical starting point for most B2B SaaS teams is MRR buildup plus cohort splits: assign a probability to each account based on health score and stage, then validate those probabilities against historical cohort renewal rates for similar accounts. Regression analysis and statistical calibration improve probability accuracy over pure gut-weighting once you have enough labeled history. Add a predictive ML layer only when you have at least 12 months of stable labeled renewal outcomes and the volume to train on.
Pro Tip: Use a SaaS churn calculator to model the revenue impact of different churn scenarios before you commit to a forecast number. Seeing the dollar value of a 5-point swing in renewal rate makes the conversation with finance much more concrete.
How to build your renewal forecast: a step-by-step timeline
The renewal forecasting operating rhythm treats renewals as a continuous workflow, not a quarterly spreadsheet exercise. Here is the practical build sequence.
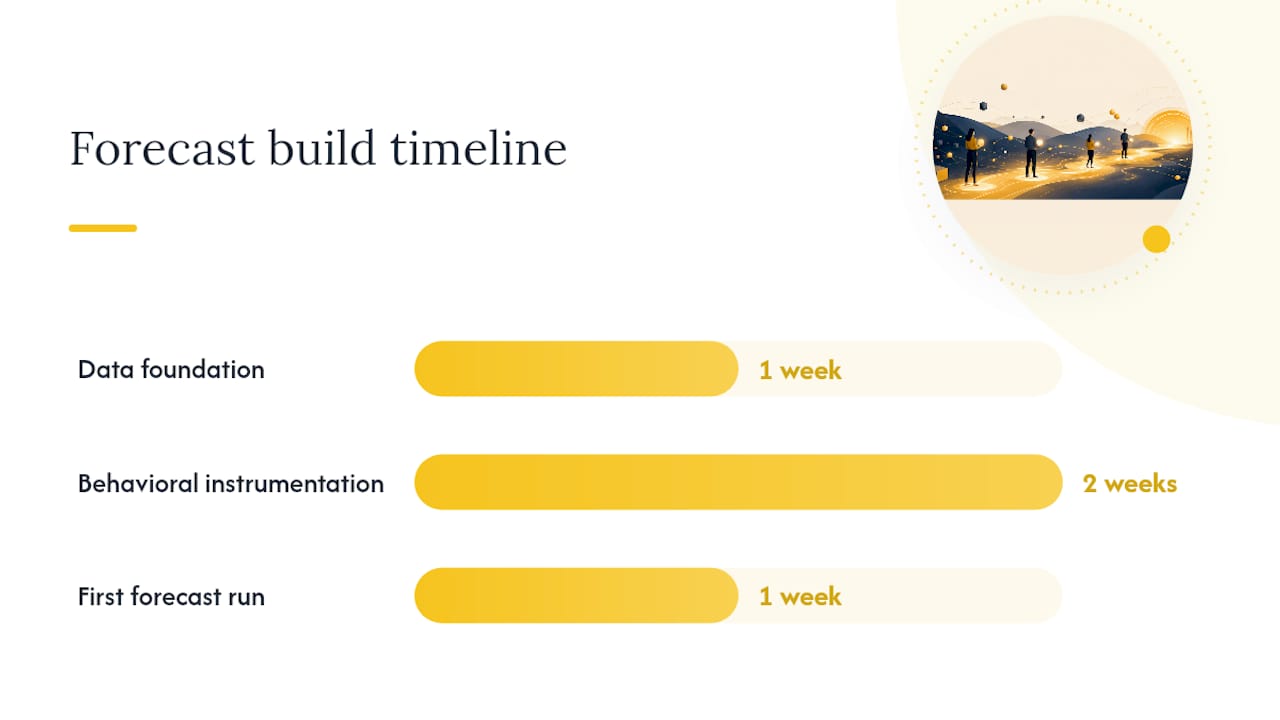
Week 1: Data foundation
- Pull all active contracts into a canonical table: account name, ARR, renewal date, owner, contract type.
- Flag every renewal occurring in the next 90–180 days.
- Connect billing data to confirm payment status and ARR accuracy.
- Identify gaps: missing renewal dates, mismatched ARR between billing and CRM.
Weeks 2–3: Behavioral instrumentation
- Connect product usage data (logins, feature events, active seats).
- Pull support ticket history and flag open high-severity tickets.
- Log last executive sponsor contact date per account.
- Build or import a health score composite from these inputs.
Week 4: First forecast run
- Assign probability buckets to every account in the 90–180 day window.
- Calculate expected renewal ARR per bucket.
- Document the assumption behind each probability assignment.
- Run first weekly review with CS and RevOps.
A recurring revenue template that separates beginning recurring revenue, new MRR, expansion, contraction, and churn, with a dedicated cohort/renewal schedule tab, prevents concentrated annual renewals from hiding inside a blended monthly number.
Operating cadence:
| Cadence | Audience | Focus |
|---|---|---|
| Weekly | CS ops, RevOps | Near-term renewals (0–60 days), save plan status, payment failures |
| Monthly | CS leadership, Finance | Model input refresh, health score updates, forecast vs. prior month |
| Quarterly | Executive, Board | Predicted vs. actual reconciliation, probability recalibration, scenario review |
Sensitivity test the two biggest levers: logo churn rate and expansion attach rate. For a 90-day pilot, measure whether your probability assignments at the start of the period predicted actual outcomes within a 10-point variance. That is your baseline accuracy target to surpass.
How to turn forecasts into retention action
A forecast that does not trigger a specific action is just reporting. The operational plumbing that connects forecast output to retention work is where most teams underinvest.
Three core playbooks:
Red-account save plan. Triggered when health score drops below a defined threshold (for example, below 40 out of 100) or when a renewal moves from Likely to At-Risk. Owner: assigned CSM. Deadline: save plan documented within 48 hours of trigger. Actions: executive sponsor outreach, product adoption review, commercial options memo.
At-risk upsell acceleration. For accounts in the At-Risk bucket where the root cause is underutilization rather than dissatisfaction, the play is adoption-led expansion: a targeted onboarding sprint on unused features tied to the customer's stated goals. This converts a potential churn into a renewal-plus-expansion.
Payment recovery workflow. A payment failure is a behavioral signal, not just a billing problem. Triggered immediately on failed charge. Owner: CS or billing ops, depending on account size. Deadline: outreach within 24 hours. Accounts with unresolved payment failures 14 days before renewal have materially lower renewal probability.
Every at-risk renewal in the forecast needs a documented save plan with a named owner and a deadline. A forecast entry without a save plan is vanity reporting. The plan does not need to be long — it needs to exist, be visible, and be updated weekly.
Handoff flow: CS owns the save plan and health score. Sales owns commercial negotiation and expansion quoting. Finance owns payment recovery escalation above a defined ARR threshold. The weekly review is where these three functions align on which accounts need cross-functional attention and who is doing what by when.
Which KPIs belong in your renewal forecast dashboard?
The dashboard your CFO trusts is not the same as the one your CS ops team runs daily. Build two views from the same underlying data.
CS ops weekly view:
- Renewals due in 0–30 days and 31–60 days, by owner
- Health score by account, flagged for week-over-week decline
- Open save plans: status, owner, last update
- Payment failures: unresolved count and total ARR at risk
- Churn rate trend by cohort
Executive and CFO monthly pack:
- Renewal base ARR for the quarter, segmented by probability bucket
- Forecasted renewal revenue (expected value sum) vs. prior forecast
- GRR and NRR trend, with a 3-month rolling view
- Forecast accuracy: actual renewal ARR vs. forecast from 30 and 60 days prior
- Save plan success rate: accounts that moved from At-Risk to Commit or Likely
Forecast quality metrics are the ones most teams skip and then regret. Track forecast accuracy (percentage variance between predicted and actual renewal ARR), stage conversion rates (how often At-Risk accounts actually churn vs. save), and save-plan success rate. These three numbers tell you whether your model is improving or drifting. Predictable renewals enable predictable growth, and that predictability only materializes when you close the loop between forecast and outcome.
Pro Tip: Publish your forecast accuracy score internally every quarter. Teams that track and share their accuracy improve faster than those that treat the forecast as a private estimate. Transparency creates accountability.
Red flags and data-quality checks to keep forecasts honest
The most dangerous forecast is one that looks precise but is built on bad inputs. These are the failure modes that are hardest to see from inside the model.
Structural red flags:
- Concentrated renewal months. If 60% of your ARR renews in two months, a single bad quarter can look catastrophic. A cohort/renewal schedule tab surfaces this concentration before it surprises you.
- Expansion masking logo churn. NRR above 100% can hide a deteriorating logo retention rate. Track logo churn and revenue churn separately; a business losing small accounts while expanding large ones has a fragility problem that NRR alone will not reveal.
- Inconsistent contract dates. When billing dates and CRM renewal dates differ by more than a few days, probability assignments become unreliable because you are forecasting against the wrong date.
Data-quality checklist:
- Missing renewal dates on more than 5% of active contracts
- Mismatched ARR between billing system and CRM
- Duplicate contract records inflating the renewal base
- Seat-count volatility not reflected in ARR (customers who dropped seats but are still billed at the old rate)
- Health score inputs that have not refreshed in more than 30 days
Operational anti-patterns: forecasts without named owners, at-risk accounts with no documented save plan, and forecast numbers that are not tied to any team incentive or performance review. When the forecast has no consequences, it has no credibility.
Pro Tip: Run a data-quality audit before your first forecast, not after your first miss. Check for missing renewal dates, duplicate contracts, and stale health score inputs. A 30-minute audit at the start saves hours of reconciliation later.
Why cadence and the two-layer data rule are the real differentiators
Most teams that struggle with renewal forecasting have the right intent but the wrong operating rhythm. They build a model once, update it when someone asks, and wonder why the numbers keep surprising them.
The renewal forecasting operating discipline that actually works runs on three distinct cadences, each serving a different purpose. Weekly reviews catch near-term problems: a payment failure, a health score drop, a save plan that has stalled. Monthly refreshes update the model inputs so the probability assignments reflect current behavioral data, not 45-day-old signals. Quarterly calibration is where you compare what you predicted against what actually happened, identify which probability buckets were systematically off, and recalibrate.
The two-layer data rule is what makes those cadences meaningful. Commercial signals alone (contract dates, ARR, CRM stage) tell you when a renewal is due. Behavioral signals tell you whether it will happen. Teams that instrument both layers detect churn risk 60–90 days earlier than teams relying on commercial data alone, because usage decline and executive disengagement show up in the behavioral layer long before a customer sends a cancellation notice. For a practical reference on which behavioral and engagement metrics to instrument, the SaaS retention metrics guide covers the key signals worth tracking.
Pilot checklist for a 90-day accuracy test:
- Minimum data: 12 months of contract history, product login events, support ticket log, and health score for at least 30 accounts renewing in the pilot window
- Baseline metric: record your probability assignments at day 0 of the pilot
- Success measure: actual renewal ARR falls within 10 percentage points of forecasted renewal ARR for each probability bucket
- Calibration trigger: any bucket that misses by more than 15 points gets its probability definition reviewed before the next quarter
Pro Tip: Treat the pilot as a learning exercise, not a performance review. The goal is to find out where your probability assumptions are wrong, not to prove the model works. Teams that approach the pilot with curiosity improve faster than those that approach it defensively.
The adoption challenge nobody talks about
The hardest part of building a renewal forecast is not the model. It is getting three or four functions to agree that the forecast is their shared responsibility.
CS leaders often resist public forecasts because a visible number creates accountability they did not sign up for. Finance teams distrust CS-generated numbers because they have been burned by optimistic pipeline before. Sales does not want to own renewal risk on accounts they closed two years ago. RevOps ends up holding a model that nobody fully believes and nobody fully owns.
The way through is to start small and show a win fast. Pick the 20 accounts renewing in the next 60 days, build the account-level forecast for just those accounts, run the weekly review for four weeks, and then show the team how the forecast compared to actual outcomes. One quarter of visible accuracy data does more for cross-functional buy-in than any methodology presentation.
Attach an owner to every at-risk renewal before the first review. Not a team, a person. The moment ownership is diffuse, save plans stall. Keep the forecast visible: a shared dashboard that CS, RevOps, and Finance can all see in real time removes the "whose number is this?" argument that kills forecast credibility.
Publish your forecast accuracy score every quarter, even when it is bad. Teams that track accuracy and share it openly improve faster than those that treat the forecast as a private estimate. The forecast becomes credible when people see it being corrected, not when it is presented as perfect.
Customerscore turns your renewal data into a repeatable forecast
Renewal forecasting only works when your commercial and behavioral data are connected, current, and visible to the right people at the right time. Customerscore is built specifically for that workflow.

The platform pulls from billing systems (Stripe, Chargebee), CRM (HubSpot, Salesforce), product analytics (Mixpanel, PostHog, Segment), and support tools (Intercom) into a single account view. Explainable health scores update automatically from those signals, so your probability assignments reflect what is happening today, not last month. Churn prediction flags at-risk accounts before the CSM notices the pattern, and built-in renewal boards and save-plan workflows give every at-risk account an owner, a deadline, and a documented next step. Slack alerts and MCP/AI agent integrations mean the right person gets notified the moment a trigger fires, without anyone having to check a dashboard manually.
If your team is ready to move from spreadsheet-based renewal tracking to a forecast that actually drives retention action, book a demo and see how Customerscore maps to your current renewal workflow.
Sources
- SaaS Revenue Forecasting: Models, Metrics and Best Practices | Stripe
- Renewal Forecasting Guide for Subscription Revenue
- Recurring Revenue Forecast Template Guide
- Renewal Forecasting: Predicting and Planning Revenue Retention - 2026
Recommended
Related articles
Benchmarked Save Playbooks: Two Churn Survey Questions for SaaS Teams
Benchmarked Save Playbooks: Two Churn Survey Questions for SaaS Teams ! Customer success manager reviewing churn survey The most effective churn survey for SaaS is a two-question in-flow cancel
Blog90–120 Day Renewal System for CSMs: SaaS Renewal Playbook
90–120 Day Renewal System for CSMs: SaaS Renewal Playbook ! Team planning a structured SaaS renewal Run renewals as a 90 to 120 day managed pipeline, not a calendar reminder.
BlogCut Response Time 60% with This Slack for Customer Success Playbook
Cut Response Time 60% with This Slack for Customer Success Playbook ! Customer success team routing a Slack conversation Slack works best for customer success when it functions as the conversation
BlogProduct Led Customer Success in 90 to 180 Days Without a Data Team
Product Led Customer Success in 90 to 180 Days Without a Data Team ! Customer success operator reviewing product signals Product-led customer success uses product usage data and in-product