
Voice of Customer SaaS: Turning Feedback Into Churn Signals


Voice of customer inside a B2B SaaS customer-success platform means one thing: usage data, support tickets, and billing events feeding a single explainable health score that flags churn risk 60 to 90 days before cancellation. That lead time comes from pairing leading indicators like login frequency and feature adoption with lagging signals such as NPS, so a CS team gets a warning while there's still time to act. A regression-validated score built on 5 to 8 weighted inputs can hit 80 to 85% predictive accuracy at a 60-day horizon. Platforms like Customerscore.io exist specifically to wire that math into daily CS operations, so the score isn't a dashboard nobody checks but a daily view of which accounts need the team and why.
Key Takeaways
A voice of customer program only reduces churn when its score is explainable, validated against real outcomes, and wired directly into SLA-driven playbooks.
| Point | Details |
|---|---|
| Lock four categories first | Use Usage, Sentiment, Relationship, and Commercial before adding any individual signal. |
| Start with 3 to 5 signals | Validate a small, trusted signal set for six months before expanding scope. |
| Validate on 18 to 24 months of data | Run logistic regression against real churn outcomes to set weights and thresholds. |
| Wire scores to SLAs, not dashboards | Route Red and Critical accounts to owners with defined response windows. |
| Recalibrate every quarter | Static weights decay as product usage patterns and customer mix shift over time. |
| Use a platform built for this | Customerscore.io integrates usage, sentiment, and billing data into one explainable score with automated playbooks. |
What to pull first
- Twelve to eighteen months of churned and retained account histories from your CRM and billing system.
- Current NPS or survey data, even if response rates are low.
- Support ticket exports with timestamps and resolution status.
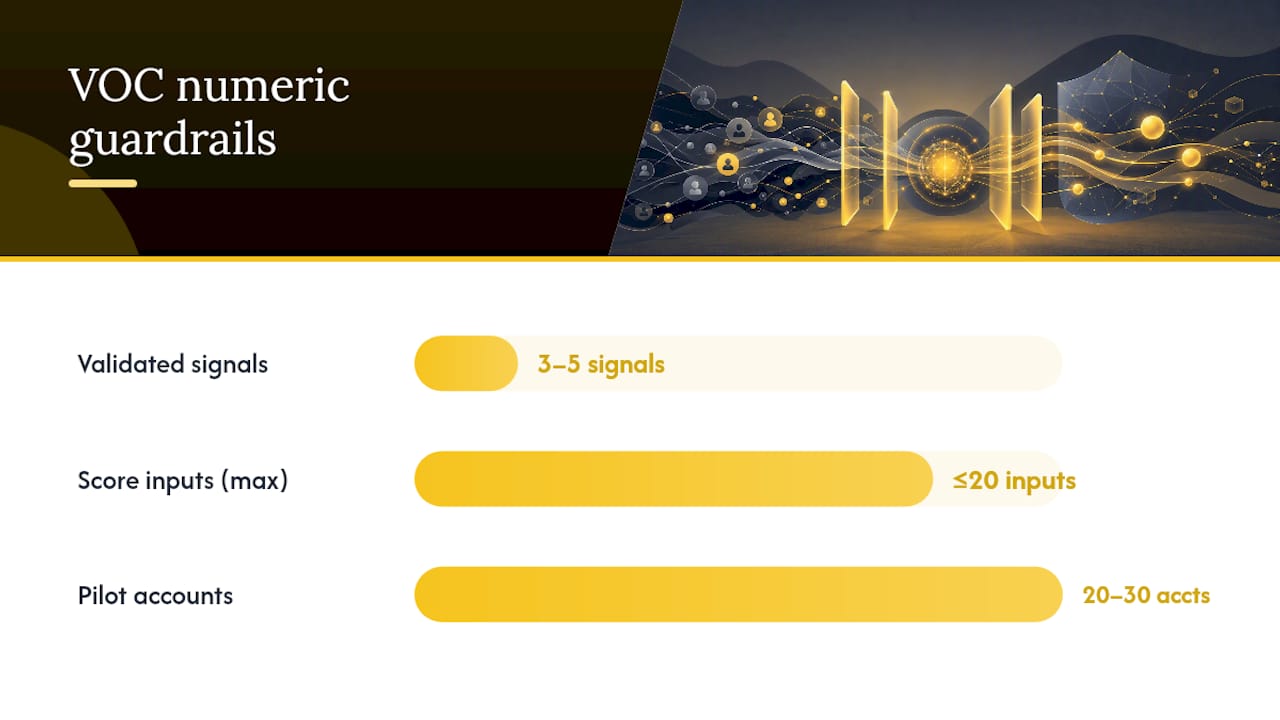
A reasonable pilot definition: 20 to 30 accounts, one score, three playbooks, measured over 90 days before expanding company-wide.
Table of Contents
- What Does Voice of Customer Mean Inside a CS Platform?
- How Do You Wire These Sources Into One Customer Profile?
- How Does VOC Become a Churn Prediction and Health Score?
- How Do You Turn Scores Into Playbooks?
- How Do You Prove This Is Working?
- What's the Realistic Timeline to Get This Running?
- What Do High-Performing Teams Get Right That Others Miss?
- See How Customerscore.io Puts This Into Practice
- Useful Resources for Deeper Implementation
- Frequently Asked Questions
- Sources
What Does Voice of Customer Mean Inside a CS Platform?
Voice of customer, in this context, is the full set of account-level feedback and behavioral signals your CS platform ingests and models: NPS and relationship surveys, support ticket volume and sentiment, product usage events, in-app feedback, and billing or commercial events like failed payments and renewal timing. This is not a standalone survey tool that collects feedback and hands you a report. It's the raw material a churn-prediction engine consumes to produce something a CSM can act on.
That distinction matters because a lot of teams still treat VOC as a side project. Run an NPS campaign twice a year, glance at the score, move on. Inside a CS platform, VOC works differently. It's continuous, it's tied to specific accounts, and it feeds a model rather than a slide deck.
A well-scoped VOC layer inside a CS platform should enable four outcomes:
- An explainable health score that a CSM can defend in a QBR without hand-waving.
- Churn prediction with enough lead time to intervene, not just document the loss.
- Automated playbook triggers so risk doesn't sit in an inbox.
- Expansion prioritization, because the same signals that flag risk also flag accounts ready to grow.
Pro Tip: Lock your signal categories before you lock your signals. A durable structure (Usage, Sentiment, Relationship, Commercial) keeps the score from turning into a junk drawer of 30 metrics nobody trusts. Pick the buckets first, then decide what goes in each one.
How Do You Wire These Sources Into One Customer Profile?
The architecture has five layers, and skipping any one of them is how teams end up with a health score nobody believes.
- Ingestion layer. Webhooks and ETL pulls from your product analytics (Mixpanel, PostHog, Amplitude), CRM (HubSpot, Salesforce), support desk (Intercom), and billing system (Stripe, Chargebee).
- Identity resolution. Stitch individual users up to the account level. A single logged-in seat means nothing; what matters is whether the account, as a whole, is engaged.
- Enrichment. Run ticket text and call transcripts through an LLM sentiment grader, tag topics, and flag escalation language.
- Feature store or warehouse. Store time-stamped features so you can compute trends, not just point-in-time snapshots.
- Scoring and action layer. The model outputs a score, and that score routes into your CS platform, CRM, and alerting tools like Slack.
Data quality determines whether this whole stack is useful or decorative. Before scoring anything, confirm:
- Events arrive with acceptable latency (real-time for critical events like failed payments, weekly recalculation for the composite score).
- Duplicate events are filtered so one webhook retry doesn't double-count a signal.
- Every seat maps cleanly to one account, with no orphaned users floating outside the account object.
- Missing values have a defined default rather than silently zeroing out a signal.
| Layer | What it does | Common failure point |
|---|---|---|
| Ingestion | Pulls raw events from source systems | Webhook drops, API rate limits |
| Identity resolution | Maps users to accounts | Multiple emails per contact, orphaned seats |
| Enrichment | Adds sentiment and topic tags | Inconsistent LLM grading across ticket volume |
| Scoring | Produces the composite number | Stale weights, no recalibration schedule |
If your product analytics stack runs on Mixpanel or PostHog, map event names to a shared taxonomy before scoring, not after. Teams that skip this step usually discover, three months in, that "feature_used" means five different things across five product teams. For platforms handling multi-tenant account structures, the architecture work resembles what SaaS engineering teams face when building for scale: identity resolution and event modeling are the hard parts, not the scoring math.
How Does VOC Become a Churn Prediction and Health Score?
Two approaches work, and the best programs run both at once.
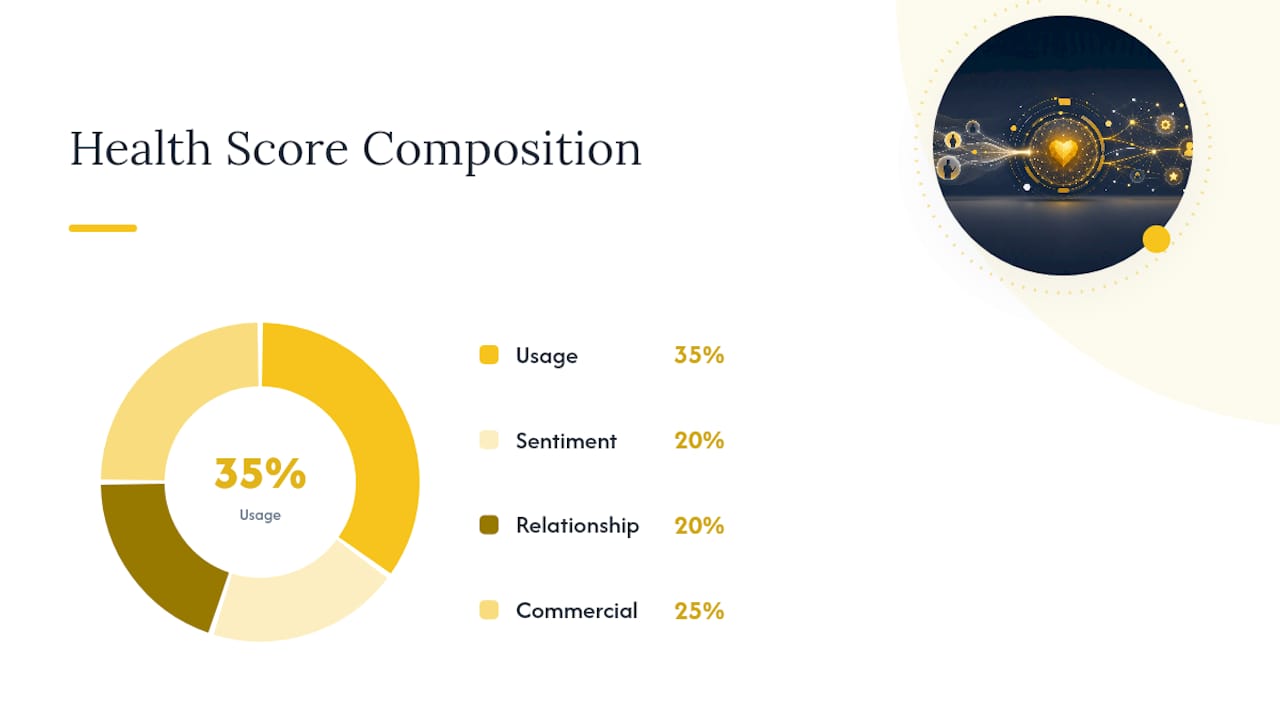
The rule-based composite score is a weighted 0 to 100 number built from your locked categories. A durable mid-market structure looks like Usage 35%, Sentiment 20%, Relationship 20%, Commercial 25%, with bands set at Red under 40, Yellow 40 to 69, Green 70 and above. It's transparent, easy to explain to a CSM, and cheap to build.
The ML predictive layer (random forest or gradient boosting) learns patterns a fixed-weight formula misses. On its own, a rule-based score typically lands around 60 to 70% accuracy; a properly validated hybrid ensemble pushes that to 80 to 85%.
Building either one follows roughly the same steps:
- Assemble 18 to 24 months of account-level monthly snapshots.
- Compute candidate signals at T-90, T-60, and T-30 before known churn outcomes.
- Run logistic regression to find statistically significant predictors.
- Translate coefficients into weights that sum to 100.
- Plot score bands against actual churn rates to calibrate thresholds.
Explainability is what makes a CSM trust the score enough to act on it. Feature importance and SHAP-style outputs let you translate a model decision into something like: "This account moved to Red because support ticket volume tripled and sentiment dropped 40% over the last two weeks, even though usage held steady." That sentence is what goes in the CSM's task, not a bare number.
Watch for temporal leakage (using a signal that only existed after the churn event), silent churners (accounts with flat usage and no complaints who cancel anyway), noisy ticketers (high-volume complainers who never leave), and model drift as your product and customer base evolve.
Pro Tip: Use the ML layer to audit the rule-based score, not replace it. When the two diverge by a material margin on the same account, that's usually where a human review catches something the formula missed.
How Do You Turn Scores Into Playbooks?
A score that doesn't trigger a workflow is merely informational, not an actionable system. The primary driver of measurable churn reduction is wiring the score to SLAs and automated routing, not the sophistication of the model behind it.
Playbooks should be specific sequences, not vague instructions to "reach out."
- Green → expansion: trigger an in-app product tour of an unused feature, then a QBR invite within 30 days.
- Yellow → proactive outreach: a personal email referencing the specific usage drop, followed by a scheduled call if no response in five days.
- Red → escalation: manager joins the next call, and a commercial review checks whether pricing or seat count is part of the problem.
- Critical → win-back: a structured save offer with a hard deadline, run by someone above the CSM's level.
Alert fatigue kills adoption faster than a bad model does. Limit yourself to three auto-triggered playbooks rather than a dozen micro-rules, rate-limit repeat alerts on the same account, and group related events into a single notification instead of five. Measure save-rate per playbook so you know which sequences actually work, not just which ones fire most often.
For teams automating this in tools like Slack or via workflow builders, a renewal automation template shows how the trigger-to-task pipeline can run without manual handoffs.
How Do You Prove This Is Working?
Executives want two numbers before anything else: save-rate and net revenue retention (NRR) impact. Everything else supports those two.
Track these on a monthly cadence:
- Model accuracy at your chosen horizon (precision and recall, not just raw accuracy).
- Time-to-detect, meaning how many days before churn the model flagged the account.
- Save-rate per playbook, tracked separately by score band.
- Churn percentage change and NRR/GRR lift, quarter over quarter.
- Playbook conversion rate, or what share of triggered playbooks resulted in a save.
Run this as a real experiment, not a company-wide rollout on day one. Split your book of business into a treatment cohort (accounts get scored and routed through playbooks) and a control cohort (business as usual), then measure over a 90 to 180 day window. That gap gives you enough time for churn to actually materialize in both groups.
A rough ROI example: if a $10 million ARR book carries 15% annual churn, and a validated scoring program improves save-rate enough to cut churn by two percentage points, that's $200,000 in preserved ARR annually. Weigh that against implementation cost and tooling spend to estimate payback timeline. Programs that measure customer success metrics consistently, rather than sporadically, tend to catch this kind of lift months earlier.
Pro Tip: Report save-rate and NRR impact to leadership before you report model accuracy. Executives care about dollars retained, not AUC scores.
What's the Realistic Timeline to Get This Running?
Nobody builds this in a sprint. Here's a defensible 90-day plan.
Days 1 to 30 (RevOps + Engineering): Instrument onboarding activation events, connect billing data for failed payments and renewal dates, and wire in your existing NPS tool if you have one.
- Map your event taxonomy across product analytics and CRM.
- Stand up identity resolution so every signal ties to one account object.
- Pick your four categories and lock the initial weights using a starting heuristic.
Days 30 to 60 (CS + Product): Wire the composite score into your CS platform and run it against historical data to sanity-check the bands.
- Validate the score against 6 to 12 months of known churn outcomes.
- Build the first three playbooks (Green, Yellow, Red) and assign owners.
- Get CSM feedback on whether the explainability output actually makes sense.
Days 60 to 90 (Full team): Launch the first regression validation with real production data and start measuring save-rate.
| Owner | Responsible for | Escalation trigger |
|---|---|---|
| RevOps | Data pipeline, identity resolution | Missing or delayed events |
| CS leadership | Model validation, weight calibration | Score/churn mismatch above 10% |
| CSMs | Playbook execution, SLA adherence | Alert not actioned within SLA |
| Executive sponsor | Budget, cross-team priority | Adoption stalls past 60 days |
The biggest risks aren't technical. They're data gaps (billing events that never made it into the pipeline), CSM adoption (a score they don't trust or understand), and over-alerting (so many notifications that everyone starts ignoring them). Address adoption early by showing CSMs the explainability output before the score goes live, not after.
What Do High-Performing Teams Get Right That Others Miss?
Many teams treat this as primarily a tooling problem, but it is often a discipline and process challenge disguised as one.
The programs that actually reduce churn aren't the ones with the most sophisticated model. They're the ones that recalibrate quarterly, without exception, because a static score decays as your product and customer base change underneath it. I've seen teams build an impressive ensemble model, skip recalibration for a year, and then wonder why the score stopped correlating with actual saves. The model wasn't broken. Nobody owned it.
A few patterns separate teams that get real value from VOC data from teams that build a dashboard and move on:
- Do start with three to five signals and validate before adding more.
- Don't let the score balloon to 20 inputs because someone in a meeting suggested "we should probably track that too."
- Do tie the score's movement to something a CSM's manager actually reviews, whether that's comp, quota credit, or a weekly standup.
- Don't launch a model to the whole CS team at once. Pilot it on 20 to 30 accounts first, and fix the explainability output before it goes wide.
- Do show CSMs the why behind every flagged account before you ask them to trust the what.
Explainability isn't a nice technical feature. It's the entire adoption strategy. A CSM who gets a red flag with no reason attached will ignore it within two weeks. A CSM who sees "ticket volume tripled, sentiment dropped 40%, usage flat" will act on it every time, because now it's information instead of noise.
See How Customerscore.io Puts This Into Practice
Customerscore.io was built around exactly the architecture this guide describes: ingest usage, sentiment, support, and billing signals into one account profile, run a hybrid score you can actually explain, and route the result straight into playbooks your CSMs already work from.
The platform connects natively to the tools most B2B SaaS teams already run, including HubSpot, Salesforce, Stripe, Mixpanel, PostHog, Segment, Chargebee, Intercom, and Slack, so you're not rebuilding your data stack to get a working score. Once connected, Customerscore.io delivers:
- Automated churn prediction with a defensible lead time, not a black-box number.
- An explainable customer health score that shows CSMs exactly why an account moved bands.
- Pre-built onboarding, renewal, and expansion playbooks that trigger automatically off score changes.
- Real-time alerts routed to the right owner, with SLAs baked into the workflow.
If your team is currently running this on spreadsheets or evaluating a switch from another platform, the Planhat alternative comparison walks through what changes when the scoring and the workflow live in the same system. The most direct next step is to book a demo and see the health score and playbooks on a demo account.
Useful Resources for Deeper Implementation
- Customer Health Score: Build an Early Warning System: the clearest breakdown of leading versus lagging churn signals and why a 60 to 90 day lead time is achievable.
- Customer Health Score Design for SaaS CS in 2027: the source for the four-bucket weighting model and recalibration cadence used throughout this guide.
- How do you build predictive churn models using unstructured data?: practical detail on turning support ticket text into usable churn features.
- SaaS Customer Success Glossary: a 100-term reference for CS and RevOps vocabulary used across this article.
- Customer Success Metrics: a companion read for building the KPI dashboard leadership will actually check.
Frequently Asked Questions
What is voice of customer in a SaaS customer-success context? It's the combined set of usage, sentiment, support, and billing signals a CS platform ingests to build an explainable health score and predict churn, distinct from standalone survey tools that only collect feedback.
How far in advance can VOC data predict churn? A well-built score typically flags risk 60 to 90 days before cancellation, giving CSMs enough runway to run a real intervention rather than a farewell call.
How many data sources do I need to start? Three to five trusted signals, such as usage, NPS, open support tickets, and payment status, are enough to launch a validated pilot before expanding to unstructured sources like call transcripts.
How often should the health score be recalibrated? Quarterly recalibration is the standard cadence, and it can improve predictive accuracy by 8 to 12 percentage points over a static score left untouched for a year.
Do I need machine learning, or is a rule-based score enough? A rule-based composite score is a solid starting point and easy to explain, but pairing it with an ML layer in a hybrid ensemble typically lifts accuracy from the 60 to 70% range into the 80 to 85% range.
Sources
Not every signal earns its place. Some predict churn 90 days out; others confirm what you already knew the week the account canceled. Here's how the primary sources break down.
Product usage gives you the earliest and most granular read: daily/monthly active users, feature adoption rate, and activation completion. A drop in login frequency is one of the strongest leading indicators available, often visible weeks before a support ticket or survey response would show anything.
NPS and relationship surveys carry real weight, but they lag usage data. By the time a customer scores you a 3, they've usually already mentally checked out. Still, sentiment trends tend to lead usage decay by 30 to 90 days, which makes sentiment trajectory (is it improving or sliding) far more useful than a single snapshot score.
Support tickets are underrated as a churn signal. Volume spikes, escalation rates, and sentiment extracted from ticket text can capture 40 to 60% of churn events in the top risk decile for accounts with enough ticket history to model against.
Billing and commercial events are the most concrete signal you have: days sales outstanding (DSO), failed payment attempts, and months remaining until renewal. These don't predict churn so much as confirm it's already underway.
Pro Tip: Don't try to ingest all five sources on day one. Start with three to five signals you can actually trust (usage, NPS, open tickets, payment status) and expand once you've validated six months of data against real churn outcomes.
- Customer Health Score: Build an Early Warning System | SurveyGauge
- Customer Health Score: Building an Early Warning System for Churn
- Customer Health Score Design for SaaS CS in 2027
- How do you build predictive churn models using unstructured…?
Recommended
Related articles
Cut CSM Intervention 18%: Predictive Playbooks for CS & RevOps
Cut CSM Intervention 18%: Predictive Playbooks for CS & RevOps ! Predictive playbook geometric title card Predictive playbooks link a churn prediction to a specific, repeatable action so customer
BlogPinpoint B2B SaaS Adoption Gaps and the Fix That Lifts Renewal
Pinpoint B2B SaaS Adoption Gaps and the Fix That Lifts Renewal ! Analysts reviewing SaaS adoption gaps Adoption gap analysis identifies the funnel stage where eligible users or accounts fail to reach
BlogAnalysts: 6–12 Month Cohort Forecasts for Net Dollar Retention
Analysts: 6–12 Month Cohort Forecasts for Net Dollar Retention ! Analyst reviewing cohort retention forecast The most reliable way to forecast net dollar retention is cohort-based modeling that
BlogStop Surprise Churn: 5 Phase Data Mapping for RevOps and CS
Stop Surprise Churn: 5 Phase Data Mapping for RevOps and CS ! Analyst mapping customer data fields Data mapping for CS means connecting product usage, billing, CRM, and support data to the fields your