
B2B SaaS CSMs: Segment Customer Success with 4 Copy Ready Plays


The winning formula for most B2B SaaS teams is a hybrid: combine ARR/ACV value tiers with product usage behavior and needs-based use cases. Done right, this lets you segment customer success in a way that fixes CSM coverage gaps, catches churn risk weeks earlier, and surfaces expansion opportunities that a single health score would bury. Some customer success teams build this on top of an explainable health score tracked against NRR by segment, not company-wide.
TL;DR:
- Segmenting accounts by ARR/ACV bands, customer size, and vertical helps identify specific churn drivers and expansion opportunities that are hidden in aggregated metrics.
- Combining usage cohorts with ARR or other traits provides early warning signals for churn and more targeted expansion efforts, especially when enough volume and data quality are available.
- Using real-time, explainable health scores built from multiple data sources enables proactive prioritization and automation across different customer segments and coverage models.
- Regular review and clear ownership of segments, along with accurate, consistent data, prevent segmentation models from becoming outdated and ensure they drive meaningful customer success actions.
- Automating segmentation and health scoring with tools like Customerscore reduces manual data work, speeds up risk detection, and makes personalized playbooks scalable for large customer bases.
Table of Contents
- Why Segmentation Matters for Customer Success
- Segmentation Models and Types That Work in B2B SaaS
- Choosing Criteria and Collecting the Right Signals
- Turning Segments Into Coverage Models and Plays
- Metrics, Dashboards, and Review Cadence by Segment
- Copy-Ready Segment Definitions and Play Templates
- How Customerscore Applies These Patterns
- What Customer Success Segmentation Actually Means
- Common Pitfalls in Customer Success Segmentation
- Aligning Segmentation Across Sales, Marketing, and Product
- Machine Learning Approaches to Dynamic Segmentation
- Case Studies: What Segmentation-Driven ROI Looks Like
- Legal and Privacy Considerations for Segmentation Data
- The Author's Take: Start Simple, Prove Value, Then Scale
- Get Segmentation Working Without the Manual Spreadsheet Work
- Sources
- FAQ
Why Segmentation Matters for Customer Success
Averages lie. A company-wide churn rate might sound manageable, but segment-level rates can vary widely, with lower churn in enterprise accounts and higher churn in SMB tiers, so the aggregate number can hide the real problem. Segmenting churn by account size, vertical, and acquisition source is the only way to find which cohort is actually driving the number, a point Rework's post-sale metrics guide makes directly.
The same logic applies to expansion. A blended net revenue retention (NRR) figure above 100% might mean everything is fine, or it might conceal differing trends such as expansion in enterprise segments alongside contraction in mid-market segments. Leadership cares about the blended number. CSMs need the segment-level breakdown to know where to act.
Modern customer success teams don't rely on one metric type. HubSpot's customer success metrics guide recommends pairing leading indicators (engagement, sentiment, product depth) with lagging ones (churn, renewal rate, lifetime value) inside the same dashboard, because leading indicators forecast what the lagging ones will eventually show.
Segmentation pays off in three concrete ways:
- Resource allocation: high-value accounts get proactive attention; low-touch accounts get scaled automation instead of wasted CSM hours.
- Earlier risk detection: a health score drop in a segment with historically low churn is a stronger signal than the same drop in a segment where it's normal noise.
- Sharper expansion targeting: usage patterns that predict upsell in one vertical rarely predict it the same way in another.
Segmentation Models and Types That Work in B2B SaaS
There's no single right model. ChurnZero's segmentation framework groups the common approaches into trait-based, value-based, needs-based, and behavior-based categories, and the model you pick should match your business stage, not a trend.
- ARR/ACV bands (value-based): Split accounts into tiers like under $10K, $10K to $50K, $50K to $250K, and $250K-plus. Works well once you have at least 50 to 100 paying accounts and want to set CSM-to-account ratios.
- Company size (SMB, mid-market, enterprise): A proxy for ARR when contract values are inconsistent. Useful early, but it can mislabel a small company paying a premium price.
- Vertical or industry: Best when your product behaves differently across sectors, like fintech versus healthcare compliance needs. Costly to maintain if your customer base is genuinely horizontal.
- Use case or outcome: Groups accounts by what they hired your product to do. Powerful for tailoring onboarding, but requires clean data on customer intent, which many teams don't collect at signup.
- Product usage cohorts: Segments by feature depth, login frequency, or time since last active session. The fastest to build if you already have product analytics, and the best early-warning signal for churn.
- Value-based or CLV: Ties segments to lifetime value rather than current ACV. Useful for prioritizing retention investment, as HBR's research on retention economics argues, since keeping the right customers beats maximizing total customer count.
- RFM (recency, frequency, monetary): Borrowed from e-commerce, works for usage-heavy products with frequent transactions or logins.
Most mature teams end up layering two axes, typically ARR band crossed with usage cohort, because a single dimension rarely explains both risk and opportunity.
Choosing Criteria and Collecting the Right Signals
The segments are only as good as the data feeding them. Pull from four sources: billing systems for ACV and contract dates, product analytics for DAU/MAU and feature depth, support platforms for ticket volume and sentiment, and CRM for renewal dates and stakeholder changes.
Primary signals worth tracking:
- Contract data: ACV, renewal date, contract length, and payment terms.
- Usage depth: daily/monthly active users, core feature adoption, and time-to-value from onboarding.
- Sentiment: NPS or CSAT scores, plus qualitative notes from QBRs.
- Support signals: ticket volume, ticket severity, and average resolution time.
Hygiene matters more than most teams expect. Use rolling windows, 30 days for usage recency, 90 days for adoption trends, 180 days for seasonal businesses, so a slow month doesn't misclassify a healthy account. Decide upfront how you'll handle nulls (a missing NPS score shouldn't zero out a health score) and bucket numeric signals into ranges rather than raw values, since "logged in 47 times" means nothing without context.
Move to clustering or ML only once you have enough volume, typically several hundred accounts, and enough history to validate that the machine-found groups actually predict outcomes better than your rules do.
Pro Tip: Before you build a single segment, audit your billing and product analytics for the same 20 accounts side by side. If the ACV in your CRM doesn't match what's in Stripe or Chargebee, fix that gap first. No amount of clever clustering fixes bad source data.
Turning Segments Into Coverage Models and Plays
Segmentation is only useful once it changes how CSM time gets spent. Three coverage models cover most B2B SaaS teams:
- High-touch: dedicated CSM, typically for top ARR bands or strategic accounts, with quarterly business reviews and named points of contact.
- Pod or light-touch: a small team covers a batch of mid-market accounts, using shared playbooks and scheduled check-ins rather than 1:1 relationships.
- One-to-many (tech-touch): automated onboarding sequences, in-app nudges, and email campaigns cover the long tail, often SMB accounts, with no dedicated human unless a risk alert fires.
Each model needs its own plays. For high-touch accounts: run a structured 90-day onboarding plan with milestone check-ins, escalate any health score drop below a defined threshold within 24 hours, and build a quarterly expansion review tied to usage growth. For pod-coverage accounts: batch onboarding by cohort start date, trigger an automated risk email plus a CSM call when two leading indicators dip together, and flag expansion candidates for a light-touch upsell email rather than a call. For one-to-many accounts: rely entirely on in-app guidance for onboarding, route any support ticket tagged "cancel" or "downgrade" straight to a retention specialist, and use usage-triggered emails for expansion rather than outreach.
Orchestration is what makes this scale. Route alerts automatically: high-touch escalations go to the named CSM, pod alerts go to a shared queue, tech-touch alerts trigger automation first and only escalate to a human after two failed nudges. Build clear handoff rules to sales for expansion signals and to support for technical blockers, so nothing sits in a CSM's inbox waiting for a decision that another team should make.
Metrics, Dashboards, and Review Cadence by Segment
You need the same core KPIs for every segment, just interpreted with different baselines. Track health score distribution, churn rate, NRR, expansion MRR, product adoption depth, and CSAT or NPS, then always break them down by the segment axes you chose, ARR band and usage cohort being the most common pairing.
Dashboards should serve two different jobs. Real-time dashboards, showing health score drops and alert queues, belong in front of CSMs daily. Scorecards, summarizing NRR and churn trends by segment, belong in front of leadership monthly or quarterly. Mixing the two into one view usually means nobody looks at it consistently.
Cadence matters as much as the metrics themselves:
- Weekly: review leading indicators (usage drops, sentiment changes, open at-risk alerts) per segment.
- Monthly: review tactical metrics like onboarding completion rate and support ticket trends.
- Quarterly: review strategic metrics, NRR, churn rate, and expansion MRR by segment, with leadership.
Segmenting churn by account size and acquisition source, as Rework's KPI research recommends, consistently surfaces problems a blended churn number hides entirely. A health score built from connected product and billing signals makes that segment-level view something a CSM can act on in minutes, not something buried in a quarterly spreadsheet.
Copy-Ready Segment Definitions and Play Templates
Four segment definitions you can adapt directly:
- At-risk enterprise: high ACV, significant usage decline over a few months, and no executive contact recently. Primary metric: health score trend. Play: escalate to CSM within 24 hours, schedule an executive check-in call, document blockers and route technical ones to support with a defined SLA.
- Onboarding SMB: recently signed accounts with low adoption of core features. Primary metric: time-to-value. Play: trigger an automated onboarding email sequence, flag stalled accounts (no login in 7 days) for a CSM nudge, measure completion against a 30-day milestone.
- Expansion-ready mid-market: mid-range ACV accounts with rapidly increasing usage and approaching plan limits. Primary metric: expansion MRR. Play: alert the CSM or sales for an upsell conversation, share usage data as social proof, follow up within 5 business days.
- Healthy but silent enterprise: ACV over $100K, stable usage, no support tickets or QBR in 90 days. Primary metric: NPS/CSAT. Play: schedule a proactive check-in, send a light survey, watch for silent disengagement disguised as "no news is good news."
Build a simple template for each play type, trigger condition, owner, action, and success metric, and store it where your team actually works, not in a slide deck nobody reopens. Test new plays on a small slice of a segment before rolling them out fully, and track whether the play measurably changed the primary metric within 30 to 60 days before calling it validated.
How Customerscore Applies These Patterns
Customerscore is built around the exact workflow this guide describes: pull signals from billing, product usage, CRM, and support into one place, then generate a health score you can explain line by line rather than trust blindly.
- Explainable health scoring shows which specific signals, a usage drop, a stalled onboarding, a support spike, are driving a segment's risk, not just a black-box number.
- Churn prediction flags at-risk accounts inside a segment before the lagging churn metric catches up, using the same multi-source signal approach described above.
- Playbook automation turns segment rules into real-time alerts and routing, matching the coverage models in this guide without manual spreadsheet work.
- The same platform covers both automated one-to-many segments and accounts that need dedicated CSM attention, rather than splitting them across feature tiers; pricing is a flat fee tiered by your client ARR, quoted from the Customerscore pricing page.
For a deeper look at implementation, the Customerscore blog covers churn analysis, health score construction, and retention playbooks in more depth than this guide has room for.
What Customer Success Segmentation Actually Means
Customer success segmentation is the practice of grouping your customer base into distinct cohorts based on shared characteristics, value, behavior, or need, so your team can tailor engagement, support intensity, and messaging instead of treating every account the same.
The goal isn't just organizational tidiness. For a CS team, segmentation exists to answer three operational questions: where should CSM time go, which accounts need intervention before they churn, and which accounts are ready for more revenue. A team without segmentation ends up either overserving low-value accounts or underserving high-value ones, usually both at once, because attention gets allocated by whoever asks loudest rather than by actual risk or opportunity.
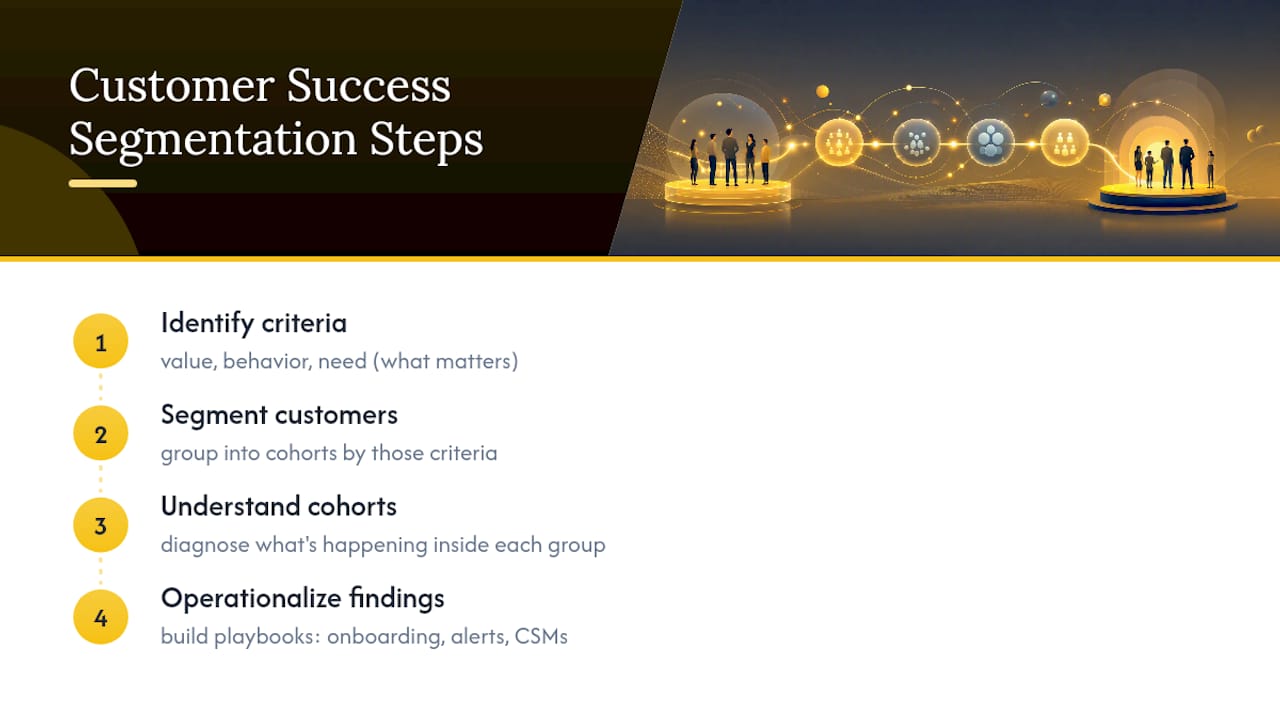
CustomerSuccess Collective's guide frames the practical process as four steps: identify the criteria that matter to your business, segment customers against those criteria, understand what's actually happening inside each group, and operationalize the findings into playbooks. That last step is where most teams stall. Building a spreadsheet with five customer tiers is easy. Turning those tiers into different onboarding sequences, different alert thresholds, and different CSM assignments is the part that actually changes retention numbers.
Segmentation goals shift as a company grows. An early-stage SaaS company segments mainly to figure out who its best-fit customer even is. A company past $10 million in ARR segments to protect revenue concentration risk and to decide where automation can replace human touch without hurting retention.
Common Pitfalls in Customer Success Segmentation
The most common mistake is building segments once and never revisiting them. A company's ARR bands from two years ago rarely match its current customer mix, and a segmentation model that made sense at 200 customers often breaks at 2,000.
A second pitfall is over-segmenting. Teams sometimes create a dozen micro-segments trying to capture every nuance, and the result is that nobody can remember which playbook applies to which group. Four to six segments is usually the practical ceiling before the system collapses under its own complexity.
Data quality is a quieter but more damaging problem. If your CRM says an account is "enterprise" but billing shows an ACV of $8,000, your segment rules will misclassify that account every time, and the CSM assigned to it will either over-invest or under-invest based on bad information.
Governance gaps cause the same failure in a different way. Without a named owner for each segment definition, a clear threshold for what triggers reclassification, and a repeatable review cadence, segments quietly drift out of sync with reality. Multiple customer success frameworks converge on the same fix: assign an owner, document the thresholds, and put a recurring review on the calendar, quarterly at minimum.
The last pitfall is treating segmentation as a one-time analytics project instead of an operational system. A segment that doesn't connect to an actual alert, playbook, or CSM assignment is just a label. It has to change what happens next for an account, or it isn't doing its job.
Aligning Segmentation Across Sales, Marketing, and Product
Segmentation breaks down fast when customer success uses one set of tiers and sales uses another. If sales calls an account "enterprise" based on deal size at signing, but CS reclassifies it as mid-market based on actual usage six months later, marketing's lifecycle emails and sales' renewal forecasts end up working from different assumptions than the CSM on the account.
The fix is a shared source of truth for segment definitions, ideally the same underlying data model, even if each team applies its own lens on top. Sales can keep its deal-size categories for pipeline forecasting, but the account's CS segment, driven by usage and health data rather than deal size alone, should be visible to sales reps too, especially ahead of renewal conversations.
Marketing benefits from the same alignment in the other direction. Product usage cohorts that CS builds for health scoring are often the same cohorts marketing needs for lifecycle email targeting or in-app messaging. Sharing that segmentation avoids marketing building a parallel, slightly different version from scratch.
Product teams have the most to gain from CS segmentation data, since usage cohorts reveal which features drive retention in which segment. When CS flags that a specific feature correlates with lower churn in the mid-market segment but not in enterprise, that's a signal for product prioritization, not just a CS talking point.
The practical mechanism is usually a shared field in the CRM or a synced data warehouse table that every team reads from, with a documented owner (usually CS or RevOps) responsible for keeping segment logic current. Without that shared layer, each team eventually builds its own version of "customer segments," and the customer experience becomes inconsistent depending on which team touches the account.
Machine Learning Approaches to Dynamic Segmentation
Rule-based segments are static by design: an account is "enterprise" until someone manually changes the rule or the ACV crosses a threshold. Machine learning approaches build segments that shift automatically as behavior changes, which matters most for teams with enough account volume to make the extra complexity worth it.
Clustering algorithms, like k-means or hierarchical clustering, group accounts by similarity across many signals at once, usage patterns, support history, and engagement, rather than the two or three dimensions a human would pick manually. This often surfaces segments a rules-based approach would miss entirely, like a cluster of mid-market accounts with enterprise-level engagement depth that deserves high-touch attention despite a modest ACV.
Predictive models take this further by scoring churn probability directly, rather than relying on a threshold like "usage down 20%." A well-trained model weighs dozens of signals simultaneously and can flag risk earlier than a simple rule would, since it can detect combinations of smaller changes that individually wouldn't trigger an alert.
The tradeoff is explainability. A model output needs to show its reasoning, which signals moved the score and by how much, or CSMs will ignore it the first time it's wrong. That's why explainable scoring matters more in practice than raw predictive accuracy: a health score nobody trusts doesn't change behavior, no matter how statistically sound it is.
The practical entry point for most teams is not full ML clustering from day one. Start with rules, accumulate clean historical data on which rule-based segments actually predicted churn or expansion correctly, and introduce clustering or predictive scoring once you have enough volume and validated history to trust the output over the rule.
Case Studies: What Segmentation-Driven ROI Looks Like
The clearest ROI case for segmentation shows up in retention economics, not acquisition. HBR's research on customer retention makes the case directly: prioritizing the retention of the right customers, identified through value-based segmentation, delivers more return than spreading equal effort across an entire customer base or chasing new logo growth.
The pattern shows up operationally too. Teams that segment churn by account size and acquisition source, rather than tracking one blended churn number, consistently find that a single channel or tier is responsible for a disproportionate share of losses. Once that segment is isolated, fixing the specific driver, a broken onboarding flow for a particular acquisition source, or a support gap for a specific vertical, moves the blended churn number more than any company-wide initiative would.
The expansion side follows the same logic in reverse. When CS segments accounts by usage depth and identifies a cohort hitting plan limits or adopting advanced features early, that cohort becomes the highest-probability expansion target. Chasing upsell conversations across the entire customer base wastes CSM time on accounts unlikely to buy more; targeting the segment that already shows expansion signals converts at a meaningfully higher rate.
The common thread across these cases isn't a specific tool or framework. It's that segmentation turns a vague goal, "reduce churn" or "grow expansion revenue", into a specific, addressable problem: this segment, this driver, this fix. That specificity is what makes the ROI measurable in the first place, since you can track whether the metric for that exact segment moved after the intervention, rather than hoping a company-wide number improves for unclear reasons.
Legal and Privacy Considerations for Segmentation Data
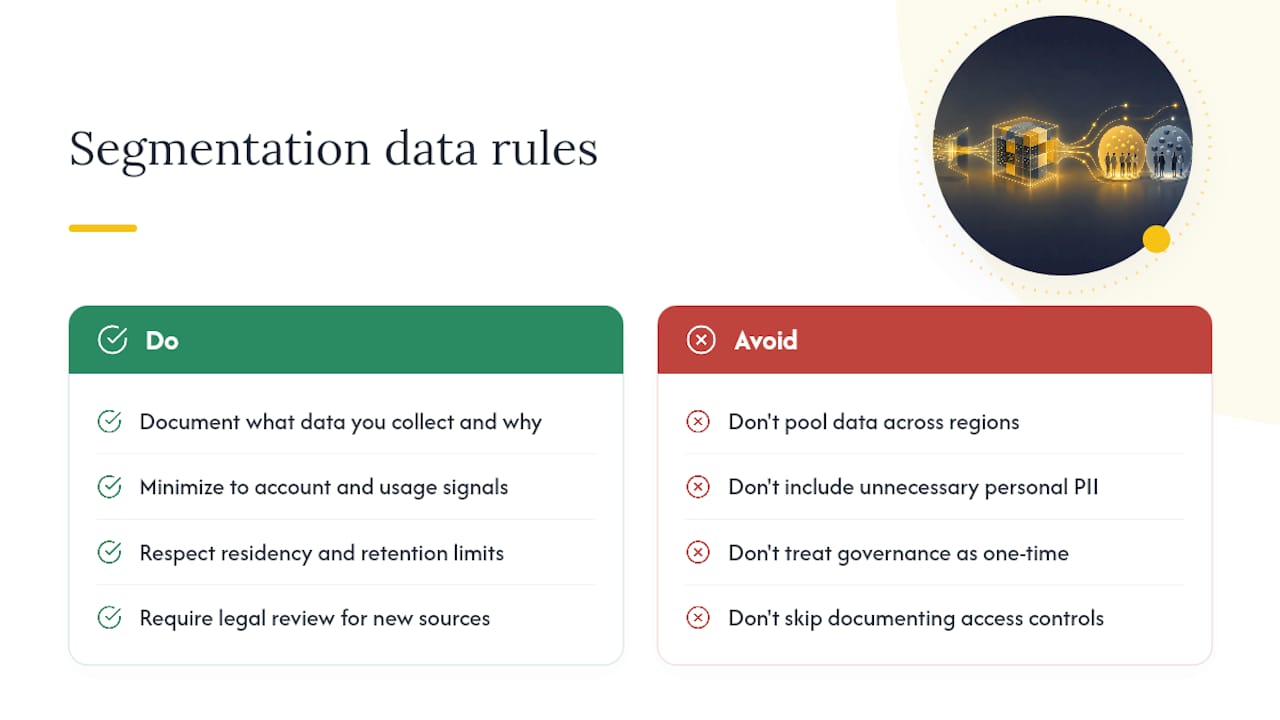
Segmentation runs on customer data pulled from billing, product usage, support, and CRM systems, and each of those sources carries its own privacy obligations depending on where your customers are located. Regulations like the EU's GDPR and various US state privacy laws (California's CCPA among them) govern how you can collect, store, and use customer data, including data used purely for internal segmentation rather than external marketing.
The practical implications for a CS team are narrower than they sound. First, be clear about what data you're using for segmentation and why, since regulations generally require a legitimate purpose for processing personal data, and "we wanted better churn prediction" is a defensible purpose when documented. Second, minimize what you actually need. Behavioral and usage data used for health scoring rarely requires the same sensitivity as personally identifiable information, so segment on account-level and usage-level signals rather than pulling in more personal data than the play requires.
Data residency and retention matter too. If your product analytics or CRM stores customer data in a specific region for compliance reasons, your segmentation pipeline needs to respect the same boundaries rather than pooling everything into a single warehouse without regard for where the underlying data is allowed to live. Retention limits apply as well. Some regulations require deleting personal data after a defined period once it's no longer needed, which means your segmentation logic should be built to handle accounts aging out of the dataset cleanly.
The safest operational habit is treating segmentation data with the same governance rigor as any other customer data: documented access controls, a clear record of what's collected and why, and a legal or compliance review before adding a new data source, especially one involving anything beyond product and billing behavior. This isn't a one-time checklist item. It's an ongoing part of running segmentation at all.
The Author's Take: Start Simple, Prove Value, Then Scale
Prioritize segments tied to revenue or high churn first. A cluster of at-risk enterprise accounts matters more in week one than a perfectly tuned SMB model. Start with deterministic rules you can explain in one sentence. Add machine learning only once you have volume and validated history behind you. Above all, assign an owner and a review date to every segment, or it quietly rots within two quarters.
— Patrik
Get Segmentation Working Without the Manual Spreadsheet Work
Customerscore is the practical shortcut for the segmentation workflow this guide just walked through. Instead of stitching together billing exports, product analytics, and CRM fields by hand every quarter, Customerscore pulls those sources into one explainable health score per account, already broken down by the segments that matter to your business.
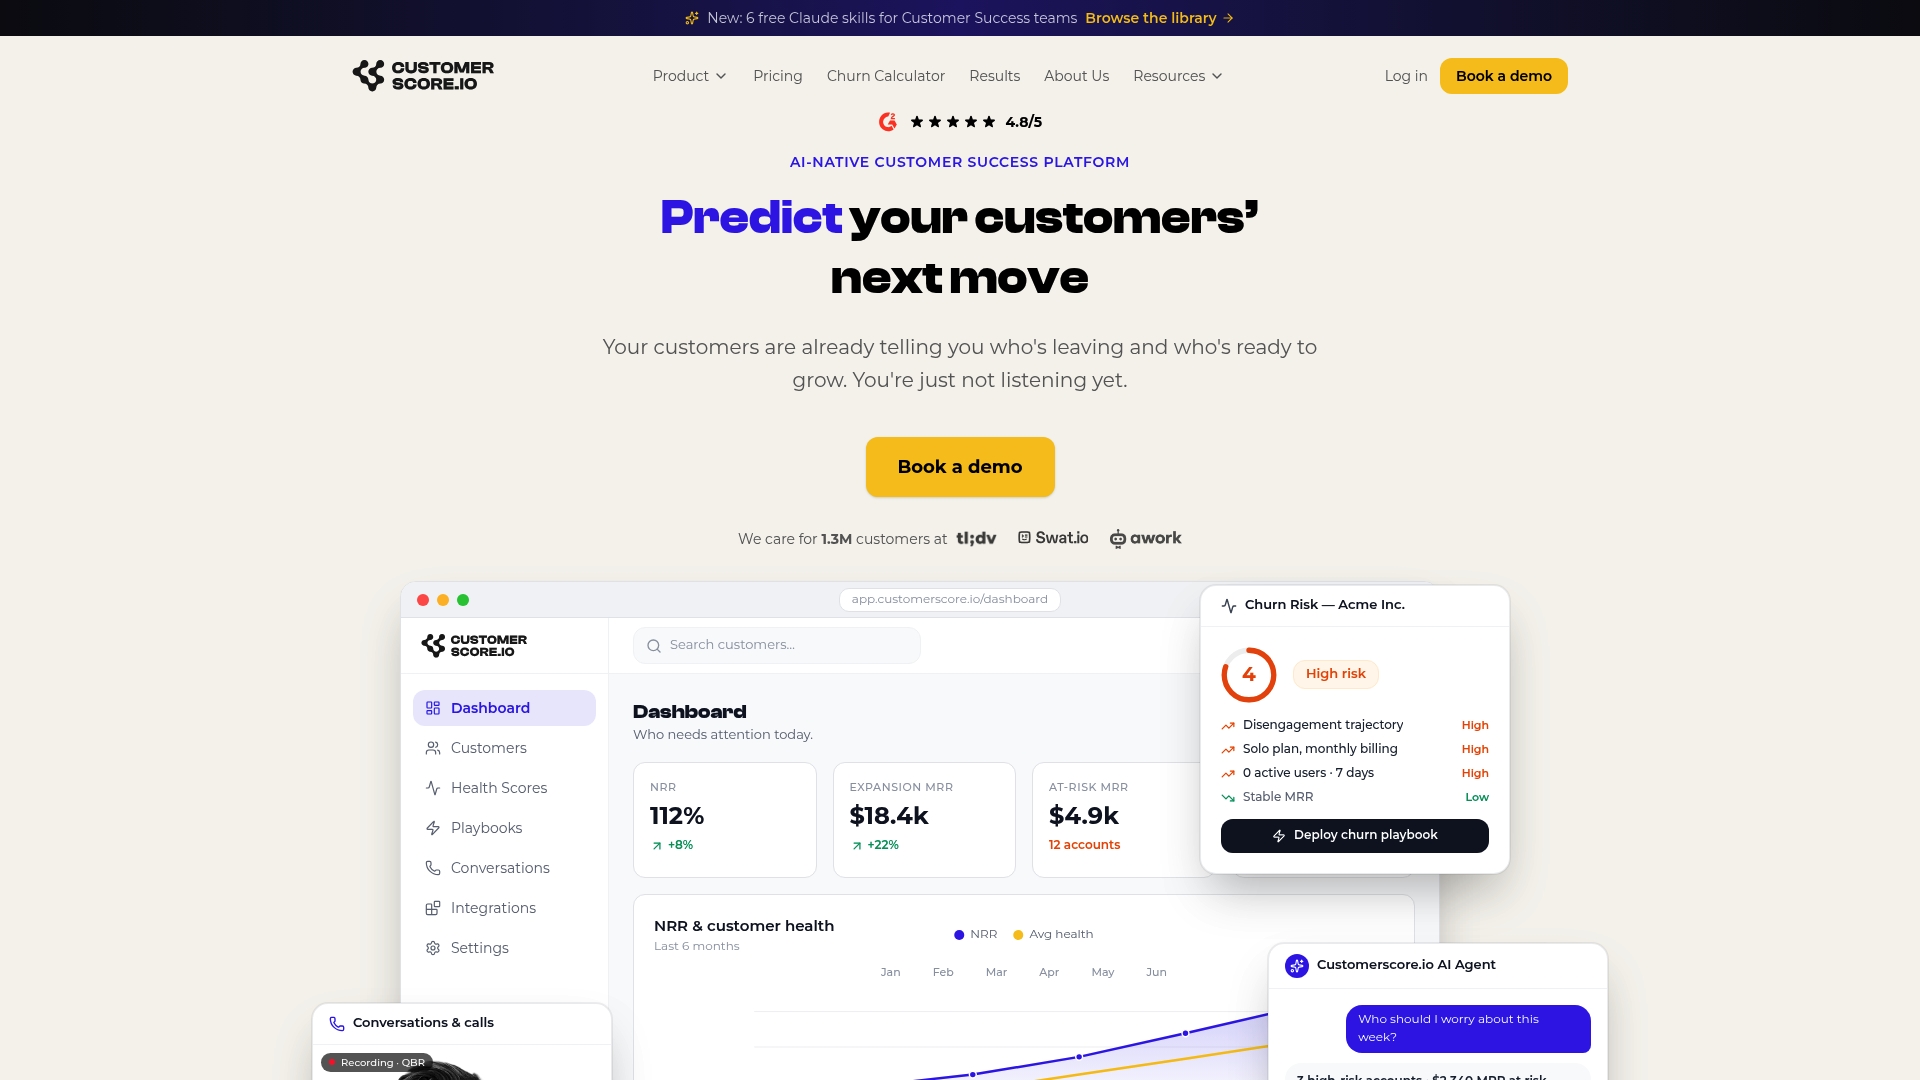
That means the at-risk enterprise segment from the templates above isn't a spreadsheet you update manually. It's a live alert routed to the right CSM the moment usage or sentiment moves, with the exact signals behind the score shown in plain language rather than buried in a model nobody trusts. Customerscore runs both motions on the same platform, automated tech-touch cohorts and accounts that need a dedicated CSM, with pricing a flat fee tiered by your client ARR rather than per seat. If churn prediction is the piece you're missing most, the AI churn prediction software page walks through how the scoring model works.
The next step is simple: book a demo and bring your current segment definitions. Most teams see within the first session which segment is bleeding retention and which one is sitting on unclaimed expansion revenue.
Sources
- The 15 customer success metrics that actually matter in 2026 — HubSpot
- A guide to customer segmentation: Strategies and examples — CustomerSuccess Collective
- Post-sale metrics guide: essential KPIs for customer success teams — Rework
FAQ
What Are the Four Types of Customer Segmentation?
The four common types used in customer success are trait-based (company attributes like industry or size), value-based (ACV or lifetime value), needs-based (the outcome the customer hired your product for), and behavior-based (product usage and engagement patterns). Most B2B SaaS teams combine at least two, typically value and behavior, according to ChurnZero's segmentation framework.
What Is a Customer Segment Example?
That segment gets a specific play, an automated alert to sales or the CSM, rather than generic outreach.
What Are the Six Steps of Customer Segmentation?
A practical version covers: identify the criteria that matter to your business, collect and clean the underlying data, segment customers against those criteria, validate that segments predict real outcomes, operationalize playbooks per segment, and review the model on a recurring cadence. This builds on the four-step process described by CustomerSuccess Collective, extended with the validation and review steps most teams skip.
What Are the Five Types of Segmentation?
Beyond the four core models (trait, value, needs, behavior), many teams add a fifth: RFM (recency, frequency, monetary), borrowed from e-commerce and useful for usage-heavy products with frequent logins or transactions. Which combination you use depends on your business stage and how much clean data you have to work with.
How Does Customerscore Help With Segmentation?
Customerscore pulls billing, product usage, CRM, and support data into one explainable health score per account, already structured around the segments a team defines. That removes the manual spreadsheet work of tracking health score and churn risk separately for each segment, and it covers both automated and dedicated-CSM segments on the same platform, whatever attention each segment needs.
Recommended
Related articles
Product Led Customer Success in 90 to 180 Days Without a Data Team
Product Led Customer Success in 90 to 180 Days Without a Data Team ! Customer success operator reviewing product signals Product-led customer success uses product usage data and in-product
BlogIntercom Customer Success: A Practical B2B SaaS Playbook
Intercom Customer Success: A Practical B2B SaaS Playbook ! Close-up of workplace with headset and laptop Intercom is a practical platform for running customer success at scale.
BlogCustomer Success Metrics: The B2B SaaS Practitioner's Guide
Customer Success Metrics: The B2B SaaS Practitioner's Guide ! CS manager reviewing SaaS customer metrics reports Track three metric groups and you have the foundation of a defensible customer success
BlogCut CSM Intervention 18%: Predictive Playbooks for CS & RevOps
Cut CSM Intervention 18%: Predictive Playbooks for CS & RevOps ! Predictive playbook geometric title card Predictive playbooks link a churn prediction to a specific, repeatable action so customer